Do conventional public opinion surveys under-report the proportion of gays and lesbians in the population? And do they underestimate the share of Americans who hold anti-gay views?
A team of researchers from Ohio State and Boston Universities say the answer to both questions is yes.
[lesbian, gay, bisexual and transgender]
The study was conducted by economists Katherine B. Coffman and Lucas C. Coffman of Ohio State University and Keith M. Marzilli Ericson of Boston University.
They used a novel research method that, in addition to the usual privacy and anonymity afforded by the best practice survey techniques, goes further and makes it virtually impossible to connect individual respondents with their answers to sensitive questions. They call this technique the “Veiled Report” method.
Then they compared their findings with the results obtained as part of the “Veiled Report” experiment with responses from a control group that answered questions posed in a more conventional way. Their goal was to see how social desirability bias—the tendency for people to not to reveal behaviors or attitudes that they fear may be viewed as outside the mainstream—may affect reporting on these sensitive topics.
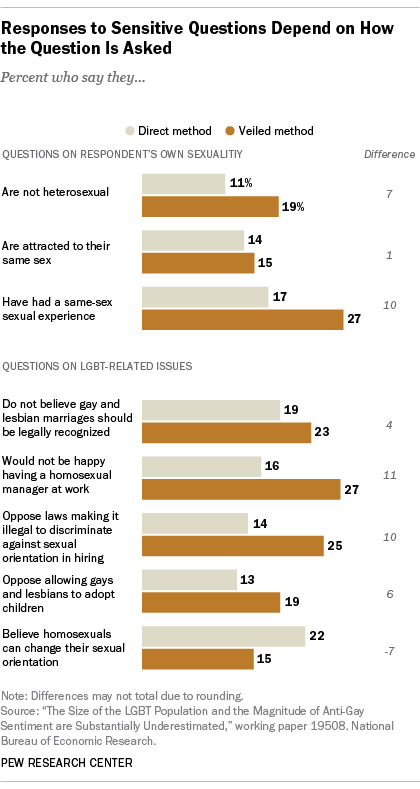
In the results using the experimental technique, self-reports of non-heterosexual identity amounted to 19% of those surveyed using the Veiled Report methods – 65% higher than the 11% in the control group. The share reporting same-sex sexual experiences also grew from 17% in the control group to 27% in the Veiled Report group, they reported. (Because their experiment did not use a random sample of the adult population, the researchers do not attempt to estimate the actual size of the country’s gay and lesbian population.)
The experimental method also increased the rates of anti-gay sentiment. For example, the share who disapproved of having an openly gay manager at work increased from 16% in the control group to 27% in the Veiled Report group. The proportion who thought it should be legal to discriminate when hiring on the basis of sexual orientation also rose from 14% to 25%.
However, those in the Veiled Report treatment were less likely than those in the Direct Report treatment to say that a homosexual person “can change their sexual orientation if they choose to do so” (22% vs. 15%). As the authors suggest, “This indicates that participants saw it more socially desirable to report that sexual orientation is changeable, which goes in the opposite direction of a general ‘pro-LGBT’ norm.”
Here’s how the experiment worked. Researchers went online to recruit more than 2,500 study participants. These recruits were randomly divided into two groups. Both groups took an online survey on their personal computer and never disclosed their names or other information that could identify them.
Members of the two groups were asked eight questions about sexuality that people might be reluctant to answer truthfully, if at all. “Three questions deal with participants’ sexuality: whether they consider themselves heterosexual, whether they are sexually attracted to members of the same sex, and whether they have had a sexual experience with someone of the same sex,” according to the researchers . “The remaining five questions examine attitudes and opinions related to sexuality—participants are asked about public policy issues, such as legal recognition of same-sex marriage, as well as personal beliefs and feelings, such as being comfortable with LGBT individuals in the workplace.”
Depending on the group, the eight survey questions were asked in slightly different ways. The first group—the “Direct Report” or control group—started with a question that looked very different from those found in a standard public opinion poll.
What they saw on their computer screen was a list of four statements and an instruction about how to answer. Here’s an example of one of the list questions used in the study the first of eight sensitive questions:

Respondents never revealed their answers to any of the four individual questions on the list. Instead, they mentally added up their “yes” responses and circled entered their total.
The remaining questions included the three that measured sexual orientation and the five that measured attitudes toward gays and lesbians. All eight appeared in a standard “yes” or “no” format as shown in the example and respondents in the control group were instructed to record their answer to each question below the question itself.
The second group—the “Veiled Report” group—got all list questions. Altogether there were eight separate list questions, each of which had four more innocuous questions and one of the eight sensitive queries.
They were again instructed to add up and record their “yes” responses to each one as a total. Unlike the control group, those in the Veiled Report group were never asked to record their answer to any of the individual items.
Here’s the list question asked of those in the Veiled Report group that is parallel to the one that the control group saw:
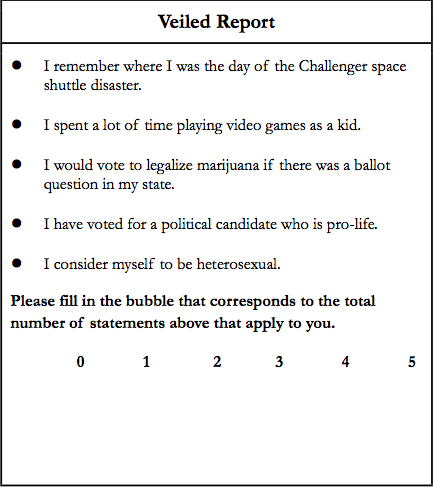
The other seven sensitive questions were framed the same way: four more benign statements and a sensitive item. Each respondent in the test group saw five questions—the original four and one of the three sexual identity questions and asked to total up and enter their “yes” responses.
By comparing the average number of “yes” answers in the two groups, researchers could estimate the proportion of the respondents in the Veiled Report group that had said yes to the sensitive question measuring.
Did the experiment work? You be the judge:
“In the Direct Report treatment, 11% of the population reports that they do not consider themselves heterosexual (8% for men, 16% for women). In the Veiled Report treatment, this increases to 19% (15% for men, 22% for women). At the same time, share of participants reporting having had a sexual experience with someone of the same sex increases from 17% in the Direct Report treatment to 27% in the Veiled Report treatment, a 59% increase,” they wrote.
No significant difference was detected between the test groups on the question asking whether the respondent was attracted to members of the opposite sex.
A cautionary note: There are many challenges in estimating the size or the composition of the LGBT population, starting with the question of whether to use a definition based solely on self-identification or whether to also include measures of sexual attraction and sexual behavior. For a detailed look at the demographic characteristics of the LGBT population, see A Survey of LGBT Americans published earlier this year by the Pew Research Center.
The study by the Ohio State and Boston University researchers, while raising questions about traditional public opinion polls, does not attempt to draw its own conclusions about size of the LGBT population or public attitudes about it since the participants were not a random or representative sample of all adults 18 and older. (The researchers used Amazon’s Mechanical Turk website to recruit participants.)
In fact, they said their study group was younger, more educated, more politically liberal and less likely to be Republican or to describe themselves as being at least “moderately religious” the country. They noted that some of the groups under-represented in their study are probably more likely to hold anti-gay views or be less willing to say that they are not heterosexual.
