
Pollsters often remind people that a poll isn’t a prediction, but a snapshot of public opinion at a point in time. Pew Research Center’s global research team takes an annual snapshot of people’s views in dozens of countries.
To make sure the Center’s surveys are nationally representative in each country, fieldwork on these polls can often take weeks to complete. So when a major global event happens while a survey is in the field – that is, while we’re conducting phone calls or sending interviewers to ask questions face-to-face – we can see opinions shift in real time. It’s a bit like a camera that moves while its shutter is open: The snapshot can capture both the subject and the motion.
On Feb. 28 this year, just after we began fieldwork in a few countries and were preparing to start in the rest, the United States and Israel launched joint airstrikes against Iran. Since we were in the field for multiple weeks in each country, we could see how views of the U.S., as well as views of each survey country’s economy, changed after the attack on Iran. Did people who answered our survey later in March or in the following months have different views from those who responded earlier?
Here are the questions about views of the U.S. and the questions about the economy used for this analysis, along with responses, and the survey methodology.
How can we determine whether attitudes are changing in real time?
Unfortunately, looking at changes during fieldwork isn’t as simple as checking the photo from a camera. Our sample size is only around 1,000 adults in most countries, and the number who took the survey in any given week is even smaller. So if we divide the sample by interview date – say, in the first week of the war versus the second – and then compare attitudes over time, the margin of error around each estimate would be very large. That uncertainty could obscure real differences between groups.
Additionally, our samples are not designed to be divided into these smaller units. The people interviewed in one week might differ demographically somewhat from those interviewed the next. That could be because face-to-face interviewers went to different parts of a country, because certain people are harder to reach by phone on the first or second try, or a number of other factors.
Given these concerns, another way to look at change during the field period is to use a statistical regression, which allows us to examine the whole sample at once rather than comparing averages across chunks of the sample. We can do this by modeling the relationship between the date of an interview and the probability of the respondent answering our questions a certain way (e.g., saying that they believe the U.S. contributes to global peace and stability or that their economy is in good shape).
Here we have a simple bivariate regression showing the association between the date of an interview and the respondent’s overall view of the U.S. In some countries, the share of people who express positive views of the U.S. went down as time passed.
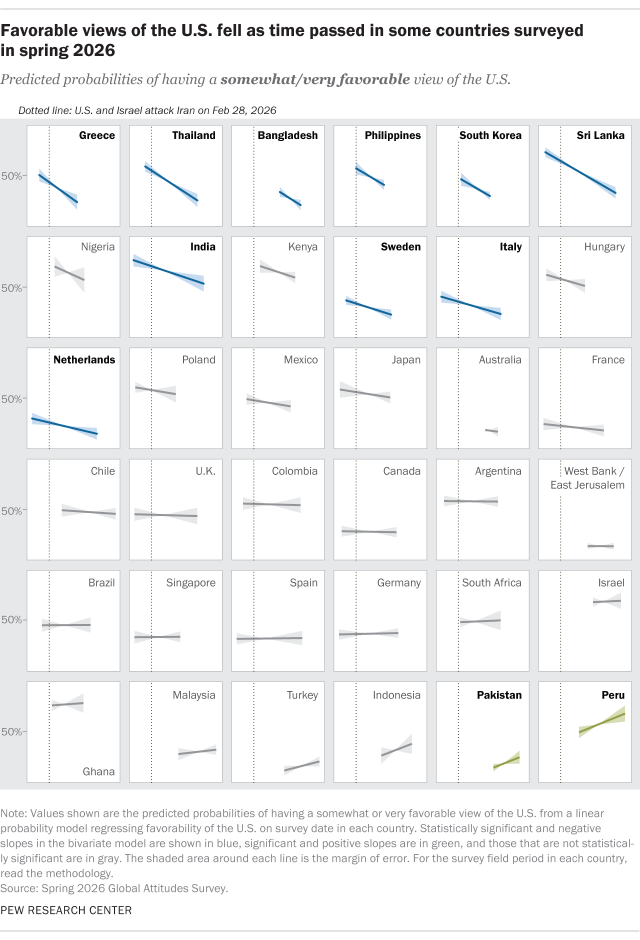
The patterns are not the same in every country, of course. In Greece and Thailand, views of the U.S. fell sharply throughout our field period. In Spain and Germany, where views of the U.S. were already quite negative last year, favorability did not change significantly during fieldwork.
A regression also allows us to statistically control for other variables, namely demographics and geography, that might not be equivalent across time periods. To make sure a change over time isn’t just the result of the way the sample rolled out, we ran regressions controlling for age, gender, education and, where available, political ideology, which are factors associated with views of the U.S. in many countries. After controlling for these, we still find that favorability toward the U.S. declined as the survey went on in some countries.
Specifically, we see significant decreases, even after adding these controls, in Greece, India, Italy, Kenya, South Korea, Sri Lanka, Sweden and Thailand. In some countries where we do not see a significant change over time, we did not begin fielding our survey until several weeks after the attack on Iran, so views might not have changed as much during our survey as a result. This set includes nearly all the Muslim-majority places surveyed, where we didn’t start fieldwork until after Ramadan and where views of the U.S. were often quite negative already. The exception is Pakistan, where views of the U.S. ticked up slightly over the survey period. Fieldwork in Pakistan began on April 8, just days before Pakistan hosted the first round of peace talks between the U.S. and Iran in Islamabad.
Looking at other topics we surveyed about, our results suggest that in numerous countries, people interviewed later were less likely to say that the U.S. contributes to global peace and stability and less likely to view the U.S. as a reliable partner. There were also slight declines in confidence in U.S. President Donald Trump to do the right thing regarding world affairs.
How did views of the national economy change while we were in the field?
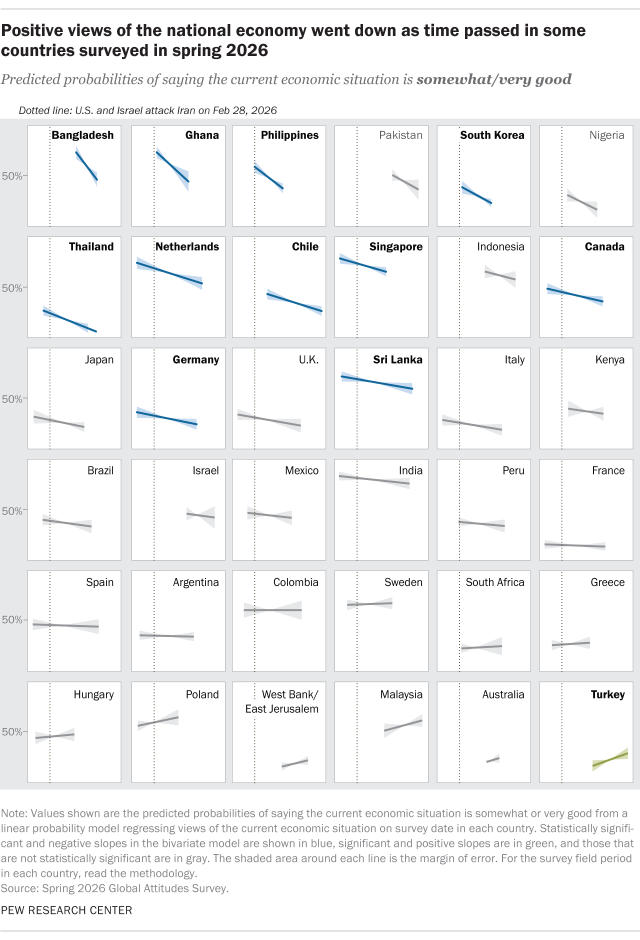
In several countries, views of the national economic situation also worsened throughout our survey period, often moving in tandem with views of the U.S.
For example, South Korea depends heavily on energy that moves through the Strait of Hormuz, and the country’s energy prices rose sharply during our fieldwork. South Koreans’ views of their economy declined significantly in the field period, as did their favorability toward the U.S.
Our findings were similar in Canada, Chile, the Netherlands, Thailand and other countries, shown below in a bivariate regression. These findings persist when we add the same controls discussed above: In around a third of survey countries, we still see significantly worsening views of the economy.
Conclusion
When big global events happen, people around the world sit up and take notice, especially when those events affect their lives and wellbeing. Statistical analysis allows us to see if people are updating their views as a result – and confirm that our surveys are capturing a genuine shift.
This year, instead of our surveys giving us one snapshot in time, we have a flip book.
Related: When the unexpected happens, what’s a survey researcher to do?