In the United States, Pew Research Center measures partisan identification by asking Americans a pair of questions. The first question asks: “In politics today, do you consider yourself a Republican, Democrat, an independent or something else?” The second question is asked of those who identify as an independent or something else in the first question. It prompts: “As of today, do you lean more to the Republican Party or more to the Democratic Party?”
About four-in-ten Americans consider themselves an independent or something else, but the vast majority of this group typically express a preference for one major party or the other. That means that around a third of U.S. adults overall can be thought of as political “leaners” – that is, people who describe themselves as an independent or something else, but still favor one party in particular.
This approach to measuring partisan identification in the U.S. works well because the nation’s political system has only two dominant political parties. But the same task is more challenging in countries with more than two prominent parties.
In cross-national surveys, the Center measures party affiliation by asking respondents instead: “Which political party do you feel closest to?” Interviewers then record the responses using a pre-coded list of options, including an option for respondents to say they don’t identify with any party. Among the countries surveyed by the Center in 2022, the share who say they do not identify with a specific party ranges from 7% in Sweden to 54% in Japan.
Given the Center’s experience with measuring partisan identification in the U.S., we experimented with a new follow-up question in some of the countries we surveyed in 2022. Most of these countries do not have a two-party system, so we structured the new question as follows: After asking people which party they feel closest to, we asked those who did not provide the name of a party whether there is one party they feel closer to than others. For those who said yes, they were asked which one, allowing us to capture the international equivalent of U.S. “leaners.”
This post will walk through the results of that experiment and its implications for our future work.
Do people in other countries lean toward certain political parties?
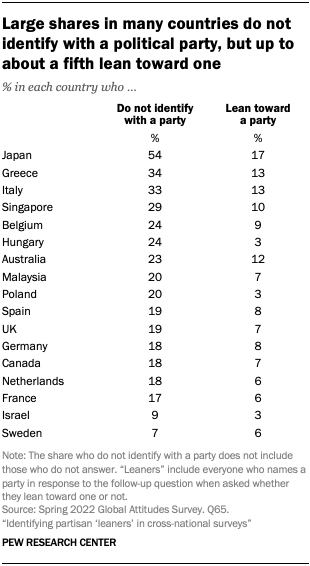
Across the 17 non-U.S. countries included in our experiment, there was wide variation in the share of adults who indicated that they lean toward a specific political party. In Hungary, Poland and Israel, for example, only 3% said they lean toward a particular party. But in Japan – the sole country where more than half of people offered no partisan affiliation when asked the first of our questions – 17% said they lean toward a party.
How are leaners different from partisans?
A key question, then, is how leaners (those who don’t closely affiliate with a party but do have a preference for one) differ from partisans (those who actively identify with a party when first prompted). It is worth noting that the sample size for leaners is relatively small in many countries.
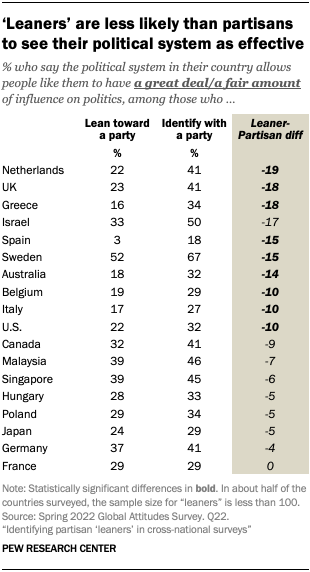
Generally speaking, leaners are less likely than partisans to see their country’s political system as effective. For example, in the United Kingdom, leaners are about half as likely as partisans (23% vs. 41%) to say their country’s political system allows people like them to have a great deal or a fair amount of influence on politics.
Leaners also tend to hold certain democratic processes in lower regard than partisans in some countries. In Spain, 62% of leaners say voting is very important for being a good member of society, while 81% of Spanish partisans say the same.
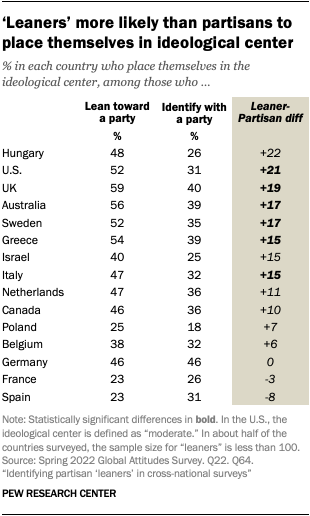
The two groups also differ in other respects, including ideology. In many countries, leaners are much more likely to describe themselves as politically moderate than partisans. In the U.S., 52% of leaners place themselves at the center of the ideological spectrum (“moderates”), compared with 31% of partisans. Partisans, in turn, are more likely than leaners to place themselves on the ideological left (“liberals”) or right (“conservatives”).
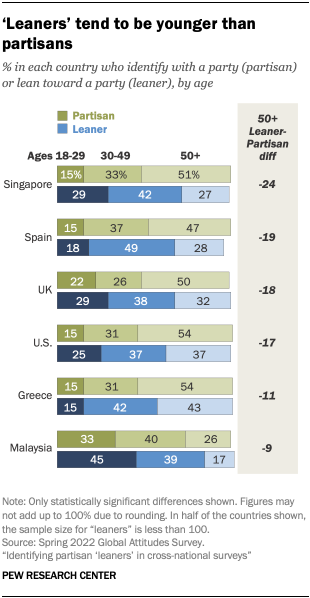
In a few countries, leaners also skew somewhat younger than partisans. For example, 29% of leaners in Singapore are under age 30, compared with only 15% of partisans. And, in many countries, partisans are more likely than leaners to be ages 50 and older. For instance, 47% of Spanish partisans are in this age group, compared with 28% of Spanish leaners.
In some countries, leaners are somewhat more likely than partisans to be women – as in the case of the Netherlands, where 66% of leaners are women, compared with 49% of partisans. However, there are some exceptions to this pattern, as in the U.S., where leaners are somewhat more likely than partisans to be men (51% vs. 46%).
Notably, leaners and partisans do not tend to differ significantly when it comes to educational attainment.
Do people who lean toward a party have similar attitudes as partisans of that party?
The next question to evaluate is whether leaners and partisans of the same political party hold similar attitudes, including in their views of political parties, democracy, the state of their nation’s economy and more.
In the U.S., independents who lean toward a party generally have similar views as those who directly affiliate with the same party, though leaners are less emphatic in their support for that party. For example, 54% of Democratic leaners have a favorable view of the Democratic Party, compared with 84% of those who identify as Democrats. Similarly, 59% of Republican leaners have a favorable view of the Republican Party, compared with 87% of those who identify as Republican.
Some of these patterns are evident among leaners and partisans in the other countries surveyed. In most places, leaners tend to have less positive views of the party they back than partisans do. In Canada, 45% of Liberal Party leaners have a positive view of the Liberal Party, compared with 82% of Liberal partisans. The same is true when it comes to views of Canada’s New Democratic Party (NDP) among both NDP leaners (76% favorable) and NDP partisans (92%), as well as views of the Conservative Party among Conservative leaners (68% favorable) and Conservative partisans (83%).
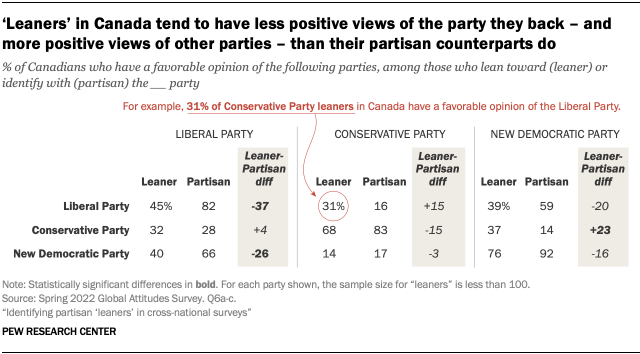
As in the U.S., leaners internationally often have less negative views of other parties than partisans do. Most often, this is the case when it comes to evaluations of the party in power. For example, in Canada, Conservative leaners are about twice as likely as Conservative partisans (31% vs. 16%) to have a favorable view of the ruling Liberal Party.
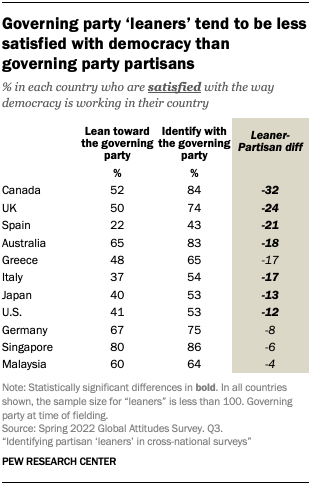
Leaners and partisans also differ in their satisfaction with democracy and their views of whether their nation’s economy is in good shape. In the UK, Conservative Party leaners are less likely than Conservative partisans to say they are satisfied with democracy in their country (50% vs. 74%) and that the British economy is in good shape (26% vs. 45%). This is particularly the case when it comes to leaners and partisans who favor the governing party. In a few countries, given the political nature of opinions about the state of democracy and the economy, opposition party leaners can be more positive about things than their partisan counterparts are. Take the example of the UK again: 41% of Labour Party leaners say the economy is in good shape while only 25% of Labour partisans say the same.
How would including leaners in our analyses change our findings?
One of the main ways we use data on political party affiliation is to look at how attitudes on issues vary among supporters of different parties. For example, we might want to know whether people who support different political parties differ in how much they trust their government to do what is right for the country. Now, because of the new cross-national leaner question we included in 2022, we can consider analyzing the leaners with the partisans. This would potentially give us more statistical power to detect cross-party differences, because of the larger sample sizes, but also might change some of the substantive findings, given that leaners and partisans have some notable demographic and attitudinal differences, as noted above. So, how would including leaners affect our findings?
Results indicate that views of key issues – including evaluations of the economy, democracy, the government’s handling of COVID-19 and the importance of voting – do not change significantly when leaners are added to partisans of the same party. For example, 74% of Social Democratic Party (SPD) leaners and SPD partisans in Germany are satisfied with democracy in their country, compared with 75% of SPD partisans alone. Among those who back Alliance 90/The Greens in Germany, 86% of leaners and partisans are satisfied with democracy, as are 86% of partisans alone.
Likewise, in Canada, 90% of Liberal partisans and leaners believe voting is very important for being a good member of society, while the same share of Liberal partisans alone hold this view. And 85% of Conservative leaners and partisans in Canada believe voting is very important, compared with 86% of Conservative partisans on their own.
Conclusion
Ultimately, this investigation shows there is some value to including a question about party leaning in our international surveys. It generates more people for analysis in some countries, thus allowing for greater power in statistical tests. And leaners resemble partisans in some important ways. Plus, in the U.S., Pew Research Center’s standard for analysis in most cases is to show results for “leaned party” (partisans and leaners together), so including this question may allow us to harmonize that approach cross-nationally.
But adding the question is not without cost on a crowded survey. And in some countries, the additional sample size generated by the follow-up question does not meaningfully affect our ability to report on specific political parties. All told, we’ll need to weigh these competing factors when deciding whether to include the leaner question on future cross-national surveys.


