

Among the tools that survey researchers use to gain a deeper understanding of public opinion are open-ended questions, which can powerfully illustrate the nuance of people’s views by allowing survey takers to respond using their own words, rather than choosing from a list of options. Yet we know from existing research that open-ended survey questions can be prone to high rates of nonresponse and wide variation in the quality of responses that are given.
We wanted to learn more about Americans’ willingness to respond to open-ended questions, as well as differences in the substantive nature of the responses they provide. In this analysis, we examine the extent to which certain characteristics – including demographic factors and the types of devices that Americans use to take our surveys – are associated with respondents’ willingness to engage with open-ended questions, as well as the length of the responses they offer. This analysis is based on an examination of open-ended responses from Pew Research Center’s American Trends Panel (ATP), a panel of more than more than 10,000 U.S. adults who are selected at random and take our surveys in a self-administered, online format.
What we did
We examined nonresponse patterns by observing the median rate of nonresponse to a set of open-ended questions asked on several ATP surveys. (We defined “nonresponse” as skipping a question entirely. As a result, we counted even insubstantial entries such as “??” as responses and did not include them in this analysis. Had we included such responses, the nonresponse rates documented here would be higher.) We also analyzed the length of responses among those who did provide answers to these questions.
But first, we had to prepare our sample of data for this analysis. We began by taking a census of the open-ended questions asked on the 58 ATP surveys conducted between November 2018 and September 2021. To be considered in this analysis, a question had to be: 1) asked as part of a general population survey, meaning the survey was sent to a sample intended to be representative of the adult population of the United States; and 2) given to the entire sample, with every respondent given the opportunity to answer the question. Using these criteria, we identified 30 open-ended questions from 26 surveys, covering a variety of topics, that could help us examine our core questions.
Measuring nonresponse rates
We identified respondents who skipped open-ended question prompts by using a vendor-created variable that identified when a respondent left an empty response box for an open-ended question.
(N who did not respond to prompt / N asked question prompt) x 100 = Nonresponse rate
Using this variable, we divided the number of respondents who did not respond to the prompt by the total number of respondents in the sample, and we multiplied the answer by 100. We called this percentage our “nonresponse rate” for each question.
We also calculated nonresponse rates, using the same formula, across key demographic groups. We examined differences by gender, age, race and ethnicity, educational attainment, partisan identification, political ideology, voter registration, self-identified urbanicity and the type of device the respondent used to take the survey.
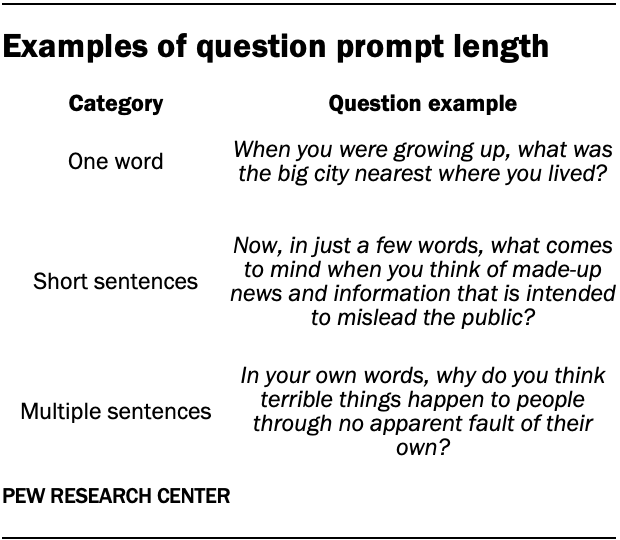
We also examined whether the rates were consistent across questions that prompted shorter or longer responses. We categorized the open-ended questions into three groups based on the prompted length of the response: 1) one-word responses; 2) short sentences; or 3) detailed descriptions in multiple sentences.
Measuring response length
We identified 19 questions that asked for responses of short or multiple sentences. For these questions, we recorded the average character count of the responses provided for each question. Using these averages, we evaluated how the length of responses differed between groups of respondents. (Note: For this analysis, we lightly cleaned responses to eliminate characters such as extra spaces or repeated punctuation marks. Different decisions about how to clean responses could lead to slightly different results than those we report here.)
What we found
Nonresponse rates vary across questions
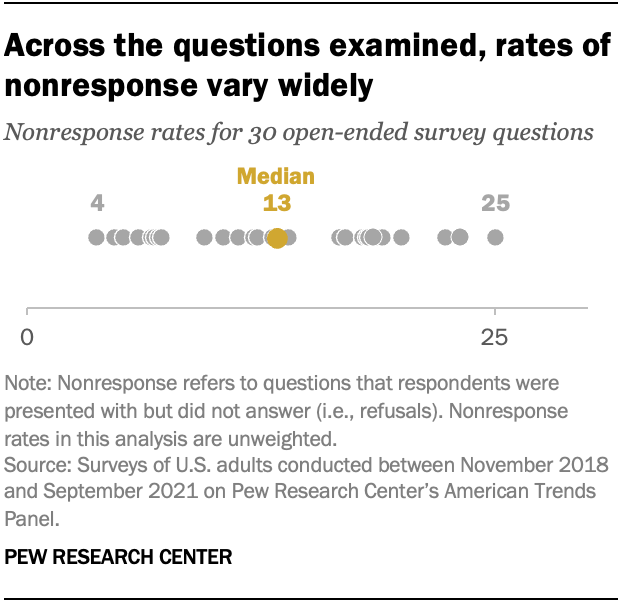
Across all 30 questions examined in this study – including those asking for just a single word and those asking for detailed descriptions – nonresponse rates ranged from 4% to 25%, with a median of 13%.
Women, younger adults, Hispanic and Black adults, and people with less formal education were less likely to respond to open-ended question prompts than men, older adults, White adults and those with more years of education, respectively.
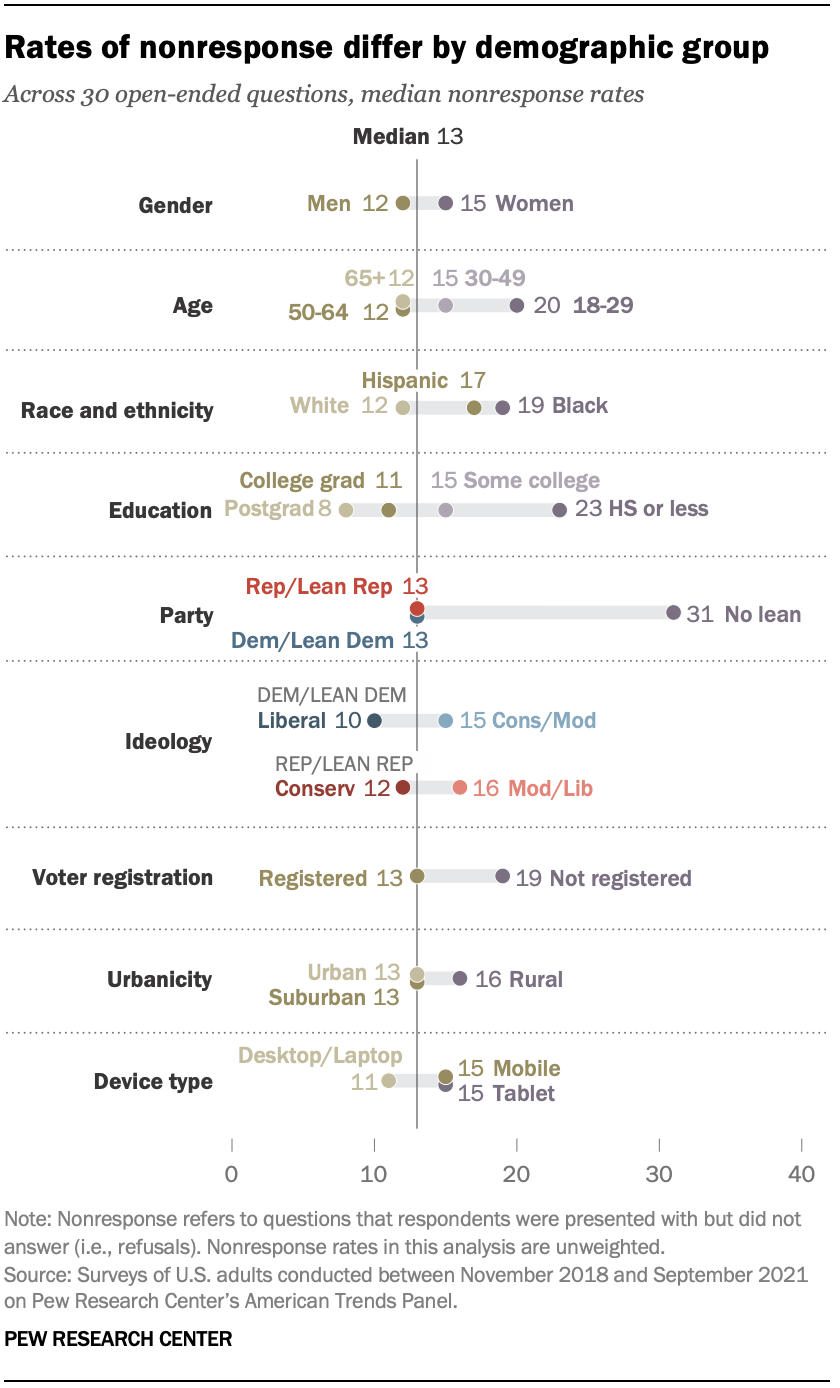
There was no difference in the median nonresponse rate by political party, with nonresponse rates of 13% for Republicans and Republican-leaning independents and for Democrats and Democratic leaners. But those who reported not leaning toward either party had a much higher median rate of nonresponse (31%).
Nonresponse rates were also higher among those who used a tablet or cellphone to take a survey (15% for each group) than among those who used a desktop or laptop computer (11%).
These aggregate patterns of nonresponse were observed across most of the individual questions examined in this study. (While this analysis was based on unweighted data, analysis that uses data weighted to population benchmarks for each survey sample produces substantively similar results.)
Prompts that ask for more detailed responses have higher nonresponse rates
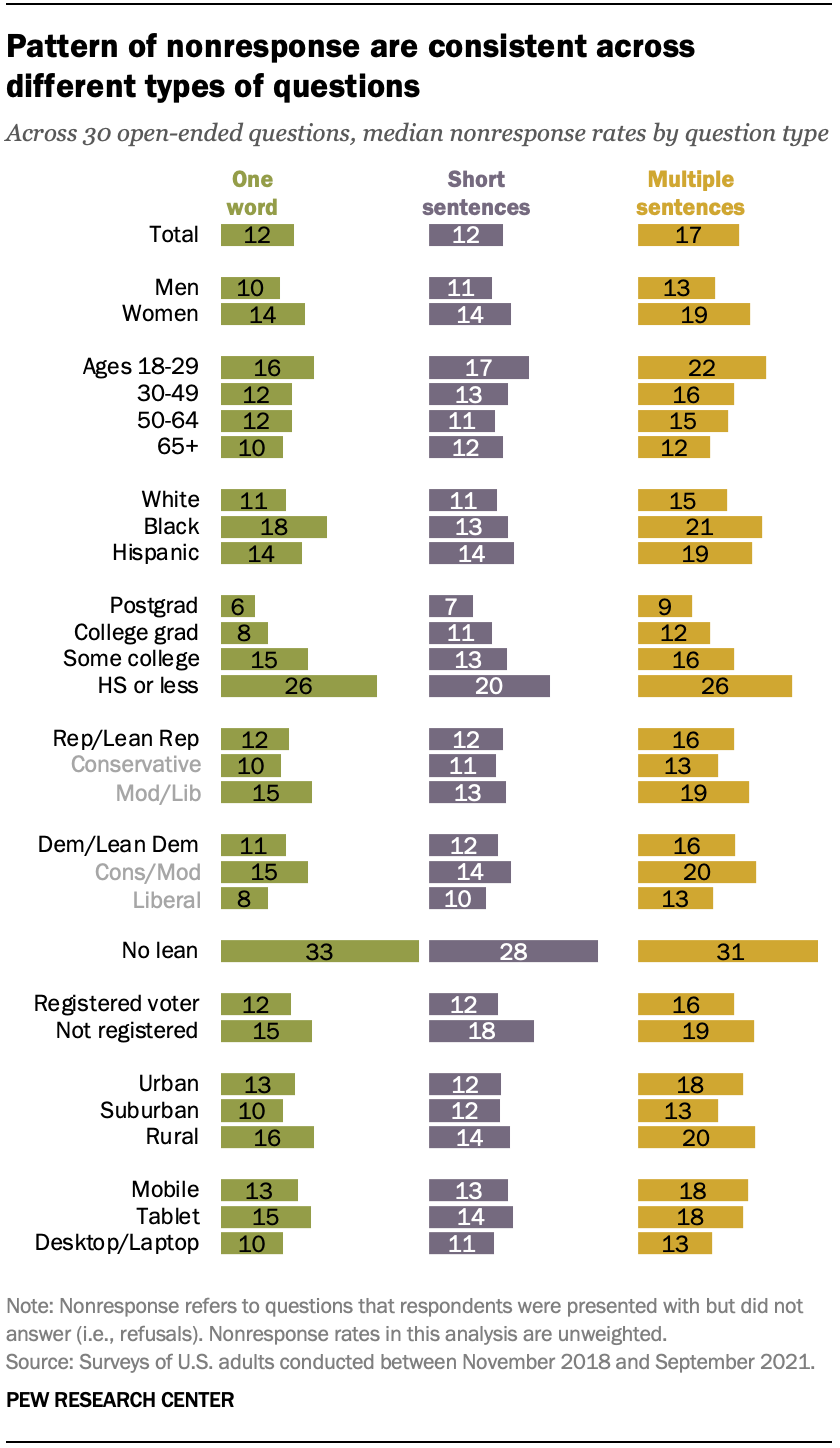
Questions that asked for a quick, one-word response and those that asked for a short sentence both had median nonresponse rates of 12%, while those that prompted for multiple sentences had a higher median nonresponse rate (17%).
However, demographic differences in nonresponse remained fairly consistent regardless of question type. For example, for all three types of questions – those asking for one word, those asking for a short sentence and those asking for multiple sentences – Americans with a high school diploma or less education were much less likely to respond than Americans with a postgraduate degree.
Marginal differences in response length across most demographic groups
Among those who did respond to open-ended prompts, there were only small differences in response length across most demographic groups. However, adults with higher levels of formal education and those who completed a survey using a computer tended to offer longer responses to questions that asked for at least a short sentence than other respondents.
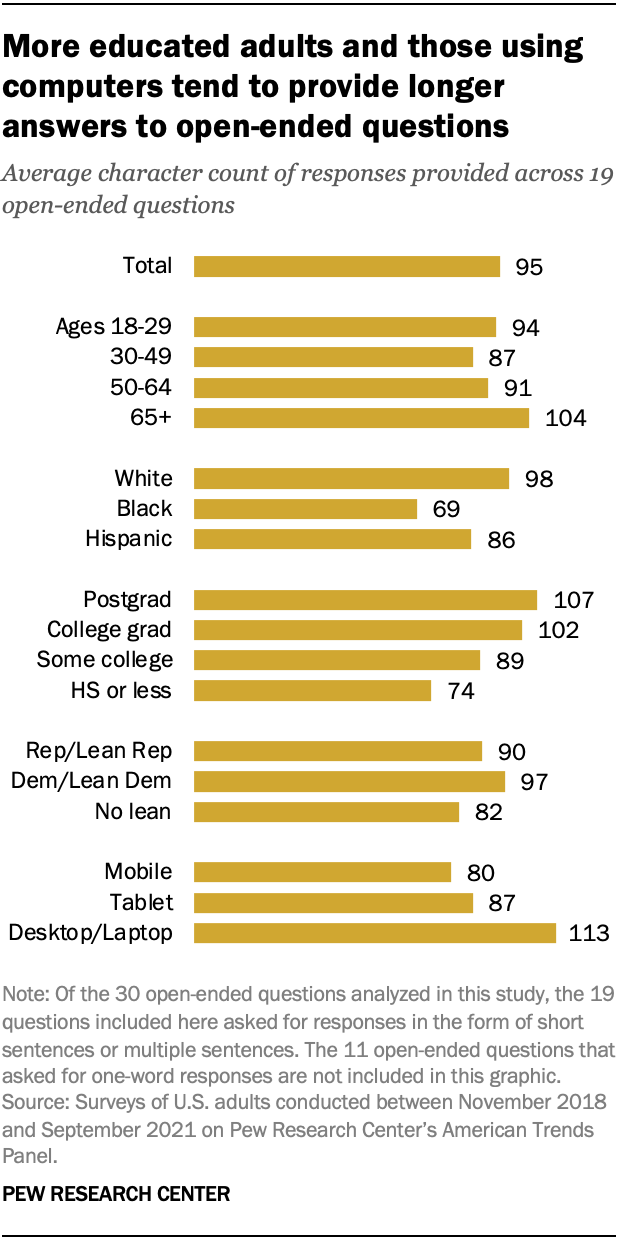
Analyzing responses across the 19 questions that asked for either short sentences or for detailed explanations, we found that adults with a postgraduate degree or a bachelor’s degree offered slightly longer responses (averaging 107 characters and 102 characters, respectively) than those with only some college experience (89) or a high school diploma or less education (74).
There were also notable differences in response length by device type. Generally, responses provided via desktop or laptop computers (113 characters, on average) were longer than responses provided on a tablet (87) or mobile device (80).
This dynamic is evident in responses to the following open-ended question, which was asked in a June 2019 survey: “In your own words, what does ‘privacy’ mean to you?” The average response length for this question was 89 characters for those using computers, 70 for those using tablets and 59 for those using mobile devices. Example responses to this question looked like this:
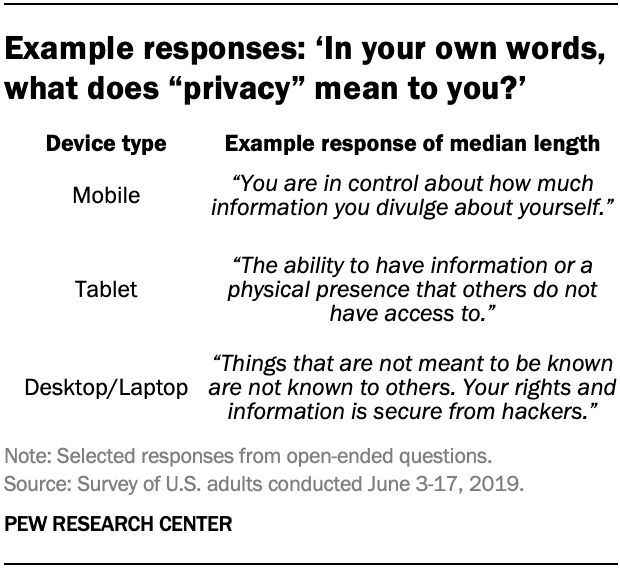
Substantively, these responses are not too different, but longer responses often provide more clarity and may mention more concepts.
Conclusion
Open-ended questions are an important tool in survey research. They allow respondents to express their opinions in their own words and can provide nuance to inform interpretation of closed-ended questions. However, researchers should examine differential nonresponse patterns to these questions, as well as differences in the substantive answers that are provided.
This analysis shows that people with lower levels of formal education, younger people, Black and Hispanic people, women and those less engaged with politics are less likely to provide responses to open-ended questions – and that some of these groups offer shorter responses on average when they do answer prompts. While the magnitude of these differences is often modest, researchers should consider that their findings may disproportionately reflect the views of those who are more likely to respond and to provide detailed responses.


