
Chapter 1: Overview
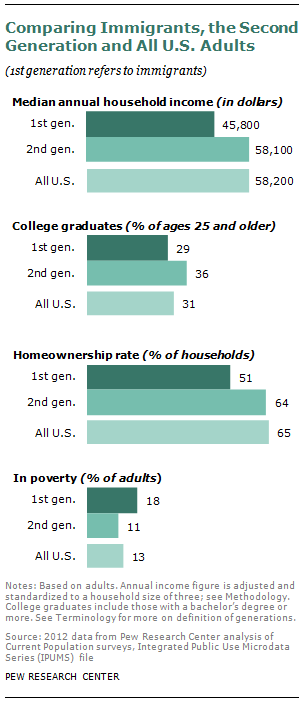
Second-generation Americans—the 20 million adult U.S.-born children of immigrants—are substantially better off than immigrants themselves on key measures of socioeconomic attainment, according to a new Pew Research Center analysis of U.S. Census Bureau data. They have higher incomes; more are college graduates and homeowners; and fewer live in poverty. In all of these measures, their characteristics resemble those of the full U.S. adult population.
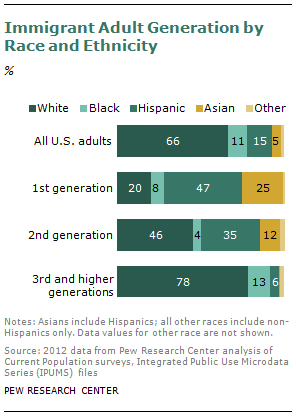
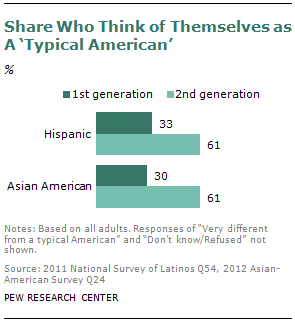
Hispanics and Asian Americans make up about seven-in-ten of today’s adult immigrants and about half of today’s adult second generation. Pew Research surveys find that the second generations of both groups are much more likely than the immigrants to speak English; to have friends and spouses outside their ethnic or racial group, to say their group gets along well with others, and to think of themselves as a “typical American.”
The Pew Research surveys also find that second-generation Hispanics and Asian Americans place more importance than does the general public on hard work and career success. They are more inclined to call themselves liberal and less likely to identify as Republicans. And for the most part they are more likely to say their standard of living is higher than that of their parents at the same stage of life. In all of these measures, the second generation resembles the immigrant generation more closely than the general public.
As the U.S. Congress gears up to consider immigration legislation, this new Pew Research report on second-generation Americans looks at the attitudes, values, life priorities, economic experiences, intergroup relations and identity markers of a group that will have a significant impact on the nation’s economy and politics for decades to come.
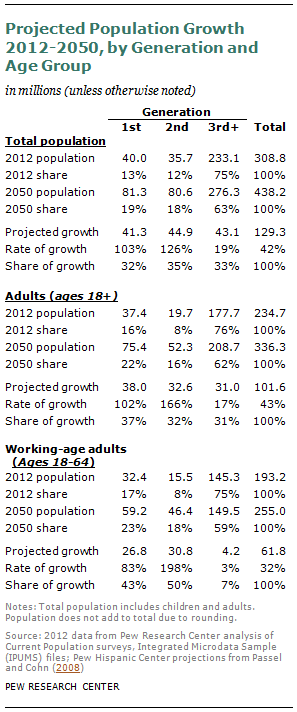
Given current immigration trends and birth rates, virtually all (93%) of the growth of the nation’s working-age population between now and 2050 will be accounted for by immigrants and their U.S.-born children, according to a population projection by the Pew Research Center.
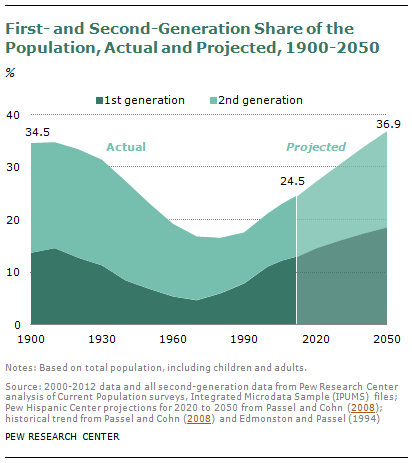
By then, the nation’s “immigrant stock” (first and second generations combined, adults and children combined) could grow from 76 million now to more than 160 million, at which point it would comprise a record share (37%) of the U.S. population.1
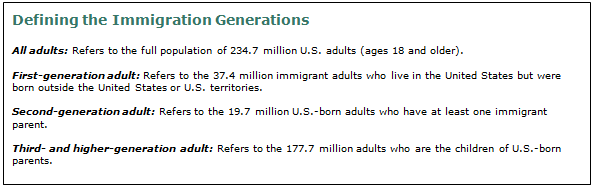
The focus of this report is on the 20 million adult members of the second generation (an additional 16 million U.S-born children of immigrants are under the age of 18).
This is a heterogeneous group that includes many younger Hispanic, Asian-American and white adults who are the children of modern-era immigrants as well as many older adults who are mostly the children of European immigrants who arrived as part of an earlier immigration wave that peaked a century ago.
Given the diversity of this population, two caveats are in order. First, the data presented here should not be interpreted as proving or disproving that there has been upward mobility between immigrant parents and their children.2 That’s because many of today’s second generation are not the children of today’s immigrants; many are the children of early 20th-century immigrants, now deceased. Second, the aggregate data on today’s second generation conceal what are often large subgroup differences by race and ethnicity. Whenever possible in this report, we disaggregate findings by these and other relevant demographic characteristics.
Here is a summary of key findings:
- Educational and Economic Attainment: Adults in the second generation are doing better than those in the first generation in median household income ($58,000 versus $46,000); college degrees (36% versus 29%); and homeownership (64% versus 51%). They are less likely to be in poverty (11% versus 18%) and less likely to have not finished high school (10% versus 28%). Most of these favorable comparisons hold up not just in the aggregate but also within each racial/ethnic subgroup (e.g., second-generation Hispanics do better than first-generation Hispanics; second-generation whites do better than first-generation whites, and so on).
Identity:
Pew Research surveys of Hispanics and Asian Americans—the groups that comprise the bulk of the modern immigration wave—find that roughly six-in-ten adults in the second generation consider themselves to be a “typical American,” about double the share of immigrants who say the same. Still, most in the second generation also have a strong sense of identity with their ancestral roots. Majorities say they identify themselves most often by their family’s country of origin (i.e., Mexican, Chinese American) or by a pan-ethnic or racial label (i.e., Hispanic or Asian American). Some 37% of second-generation Hispanics and 27% of second-generation Asian Americans say they most often describe themselves simply as “American.”- Intergroup Relations: About half of second-generation Latinos (52%) and about two-thirds of Asian Americans (64%) say their group gets along well with all other major racial and ethnic groups in America; smaller shares of Latino (26%) and Asian-American (49%) immigrants say the same. The second generations of these groups are also more likely than the immigrants to say they have friends outside of their ethnic or country of origin group.

Intermarriage.
About one-in-six (15%) married second-generation adults have a spouse of a different race or ethnicity from themselves, compared with 8% of all immigrants and 8% of all U.S. adults. Intermarriage rates are especially high for second-generation Hispanics (26%) and Asian Americans (23%).- Belief in Hard Work. About three-quarters of second-generation Hispanics (78%) and Asian Americans (72%) say that most people can get ahead if they’re willing to work hard. Similar shares of the immigrant generations of these groups agree. By contrast, 58% of the full U.S. population of adults feel the same way, while 40% say that hard work is no guarantee of success.
Political and Social Values:
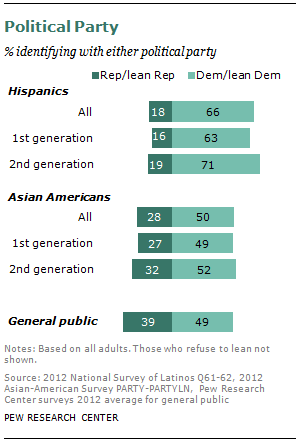
Second-generation Hispanics and Asian Americans, as well the first generation of each group, identify more with the Democratic Party than the Republican Party and characterize themselves as liberals at higher rates than the general public. About half or more of the second generation believe that abortion should be legal, and more than two-thirds say homosexuality should be accepted by society. The relative youth of the second generation contributes to, but does not fully explain, their liberal political leanings.- Nonmarital Childbearing: In what some scholars have described as a pattern of negative assimilation, 41% of second-generation women who recently gave birth were unmarried, compared with 23% of immigrant women who recently gave birth. The higher share of nonmarital childbearing among the second generation has been driven mostly by second-generation Hispanic women (52% of these women with a recent birth were unmarried). Among the U.S. population as a whole, 36% of women who recently gave birth were not married.3
- Language Usage: About nine-in-ten second-generation Hispanic and Asian-American immigrants are proficient English speakers, substantially more than the immigrant generations of these groups. When it comes to retaining one’s ancestral language, there are sizable differences by race and ethnicity. Eight-in-ten second-generation Hispanics say they can speak Spanish at least pretty well; just four-in-ten second-generation Asian Americans say the same about their parents’ native tongue.
Perceptions of Generational Mobility.
By lopsided margins, most second-generation Hispanics (67%) and Asian Americans (75%) say their standard of living is better than that of their parents at the same stage of life. Similar shares of the immigrant generations of both groups say the same. By contrast, 60% of the full U.S. population feel the same way. Looking ahead, two-thirds of second-generation Hispanics, but 41% of Asians, believe their own children will eventually surpass their current standard of living. Overall, 48% of American adults say the same.- Comparisons with Parents’ Country of Origin: Seven-in-ten second-generation Asian Americans and eight-in-ten (81%) second-generation Hispanics say that conditions for raising children are better in the U.S. than in their parents’ country of origin. Like immigrants, they also rate the U.S more favorably than their ancestral country in terms of treatment of the poor and the opportunity to get ahead. Less than half of both generations rate the U.S. as better than their ancestral country as a place to maintain strong family ties.
- Population Projections. Immigrants tend to have higher birth rates than do native-born Americans.4 If current immigration flows and birth rates continue, then by 2050, an estimated 37% of the U.S. population—highest in modern history—will be immigrants or the children of immigrants, according to a 2008 Pew Research population projection. That projection also shows that, because of the aging of the Baby Boomer generation, as much as 93% of the growth of the working-age population between now and then will be accounted for by immigrants (43%) or their U.S.-born children (50%).
Group Differences within the Second Generation
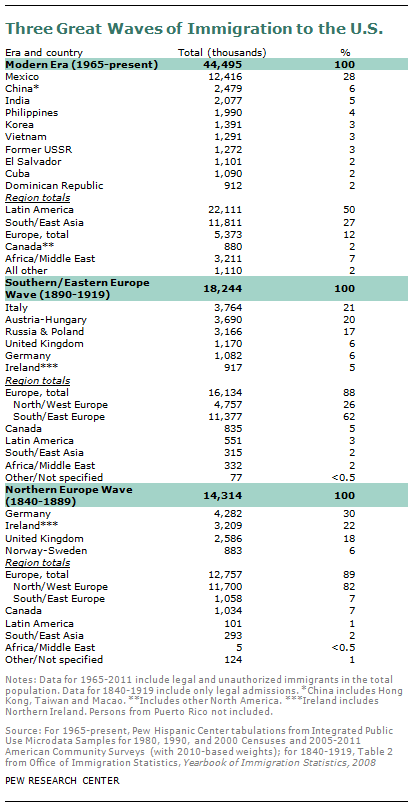
The modern immigration wave to this country began with the passage of landmark legislation in 1965 that had the effect, for the first time in the nation’s history, of opening U.S. borders on a roughly equal basis to non-Europeans as well as Europeans. Half of the 44 million immigrants who have come since then have been from Latin America, about a quarter (27%) from Asia, and the remainder from other regions.5 In the nation’s two previous immigration waves during the late 19th and early 20th centuries, nearly nine-in-ten new arrivals were Europeans.
Hispanics and Asian Americans are the focus of the Pew Research survey research findings in this report. Each of these groups include immigrants from more than a dozen countries, all with unique cultures, characteristics and migration histories.6
Despite these country-of-origin differences, some broad patterns are evident. The bulk of Hispanic immigrants have relatively low levels of formal education and work in low-skilled, low-paying jobs, while the majority of Asian immigrants (especially those who have arrived in the past few decades) have relatively high levels of education and skills that help position them for jobs in higher-skilled occupations.
These large racial or ethnic group differences in the human capital of recent immigrants are echoed in the socioeconomic profile of the second generation. For example, some 55% of second-generation Asian Americans have a bachelor’s degree or more, compared with 21% of Hispanics. There are also gaps in household income and poverty rates among second-generation Hispanics and Asian Americans.
But while large gaps remain between groups, it is also the case that within each group, the second generation is doing better than the first on most key measures of economic success.
Intergenerational Mobility, Now and Then
Some scholars of immigration have questioned whether today’s immigrants and their offspring will be able to match the high levels of intergenerational upward mobility experienced by much of the immigrant stock of the 19th and early 20th centuries.7
The skeptics cite many factors: Most modern immigrants are non-white and thus face deeply ingrained social and cultural barriers; about a quarter of today’s immigrants (the vast majority of whom are Hispanic) have arrived illegally and thus must navigate their lives in the shadows of the law; globalization and technology may have eliminated many of the jobs that provided pathways to the middle class for earlier generations of hard-working but low-skilled immigrants; the relative ease of travel and communication have enabled today’s immigrants to retain their ties to their countries of origin and may have reduced incentives to adapt to American customs and mores.
It is beyond the scope of this report to make definitive statements about the success of today’s second-generation immigrants compared with those of earlier eras. Most of our data trends do not extend that far back in history. Moreover, with so many of today’s second generation just now starting to age into adulthood (16 million are under the age of 18), and with more than a million new immigrants continuing to arrive each year, it will take decades before one can attempt a comprehensive generational scorecard of the modern wave of immigrants and their children.
What we can say with certainty is that members of the second generation will have a major impact on this nation’s destiny for decades. And at this stage of their journey, we can provide some empirical assessments of their economic circumstances. For Hispanics and Asian Americans—the groups that comprise the bulk of the modern immigration wave—we can also provide some empirical assessments of their attitudes and beliefs, based on data gathered from our own surveys and those of the Census Bureau.
A Roadmap to the Report
The remainder of this report is organized as follows: Chapter 2 presents a detailed analysis of U.S. Census Bureau data on the second generation in comparison with immigrants, with third and higher generations and with the U.S. adult population. Generational patterns are also examined separately for each of four racial and ethnic groups: Hispanics, Asian Americans, non-Hispanic whites and non-Hispanic blacks.
Chapters 3 through 7 supplement this demographic portrait with an analysis of recent Pew Research Center surveys conducted with a nationally representative sample of Hispanics and a separate representative survey of Asian Americans on a range of topics. These chapters compare the second generation with the first generation in each group. No analysis of third-and higher-generation Hispanics or Asian Americans is included due to the small sample sizes of those subgroups in the survey data. Comparisons to the general public using data from other recent Pew Research Center surveys are included wherever possible. Survey data with an adequate number of second-generation whites and blacks for analysis is not available. Thus, the survey comparisons are limited to the two race or ethnic groups comprising the bulk of the modern immigration wave. These comparisons help illuminate the ways in which the second generation tends to be similar and dissimilar to the first generation within each race or ethnic group, but they cannot be used to characterize the second generation in the U.S. as a whole.
Chapter 3 looks at questions of self-identity, proficiency in English and attitudes about maintaining their ancestral language. Chapter 4 examines how the generations see their quality of life in relation to their parents, their expectations for their children, and their perception of their financial well-being. Chapter 5 examines attitudes about intergroup relations and intergroup marriage. This chapter includes a detailed analysis of data from the U.S. Census Bureau on the rate of intergroup marriage for all adults in the U.S. and separately for Hispanics, Asian Americans, whites and blacks. Chapter 6 focuses on attitudes about political party, ideology and social issues. Chapter 7 considers a wide array of other topics, including views about discrimination, personal goals, values and comparisons between the U.S. and their ancestral country. The appendices provide a detailed explanation of the methodologies used and a topline summary of the survey findings for Hispanics and Asian Americans. They also provide detailed tables, drawn from 2012 census data, that show the socioeconomic characteristics of first, second and third and higher generations of whites, blacks, Hispanics and Asian Americans.
About the Authors
This report is a joint effort of survey researchers, demographers and writers in the Pew Research Center. Paul Taylor, executive vice president of the Pew Research Center, wrote the overview and provided editorial guidance for the report. Senior writer D’Vera Cohn wrote the demographic analysis in Chapter 2 with data analysis and advice from research associate Ana Gonzalez-Barrera, senior demographer Jeffrey S. Passel and senior researcher Gretchen M. Livingston. Wendy Wang, research associate, number-checked Chapter 2 along with the detailed demographic tables in Appendix 1 and the analysis of intermarriage in Chapter 5. Chapter 3 was written by Livingston. Chapters 4 and 6 were written by senior researcher Cary Funk. Rich Morin, senior editor, wrote Chapters 5 and 7 with the assistance of Funk and Livingston. The analysis of intermarriage in Chapter 5 also benefited from the advice of Passel and Wang. Research assistant Eileen Patten number-checked Chapters 1, 3, 4 and 5. Research assistant Seth Motel number-checked Chapters 6 and 7 and prepared charts and tables for Chapters 1 and 2. Patten, Motel and Gonzalez-Barrera also assisted with other aspects of the report including compiling and checking the topline of findings, preparing charts and formatting the final report. The report was copy-edited by Marcia Kramer of Kramer Editing Services.
The report also benefited from the advice and guidance of Mark Hugo Lopez, associate director of Pew Research Hispanic Center; Rakesh Kochhar, associate director of research of Pew Research Hispanic Center; Kim Parker, associate director of Pew Research’s Social & Demographic Trends project; Phillip Connor, research associate in the Pew Research Center’s Forum on Religion & Public Life; Scott Keeter, the Pew Research Center’s director of survey research; and Leah Christian, senior researcher in the Pew Research Center.
Notes on Terminology
All references to whites, blacks and others are to the non-Hispanic components of those populations. Asians include a small number of Hispanics. Whites, blacks and Asians are single-race-only groups. “Others” includes persons reporting single races not listed separately and persons reporting more than one race.
The terms “Latino” and “Hispanic” are used interchangeably in this report.
“Foreign born” refers to people born outside of the United States, Puerto Rico or other U.S. territories to parents neither of whom was a U.S. citizen. “Foreign born” and “immigrant” and “first generation” are used interchangeably. Unauthorized immigrants are included in this group.
“Native born” or “U.S. born” refer to people who are U.S. citizens at birth, including those born in the United States, Puerto Rico or other U.S. territories and those born abroad to parents at least one of whom was a U.S. citizen.
“Multi-generational family households” refer to those that include at least two adult generations (with the younger generation including at least one adult who is 25 years old or older) or households consisting of grandparents and grandchildren, with no parent present.
References to demographic data for all adults or the total population are to the civilian noninstitutional population included in the Current Population Survey. See Methodology for more information.
Immigrant Generations
“First generation” or “foreign born” refers to people born outside of the United States to parents neither of whom was a U.S. citizen. For this report, people born in Puerto Rico or other U.S. territories are not considered foreign born.
“Second generation” refers to people born in the United States, with at least one first-generation (immigrant) parent. People born in Puerto Rico or other U.S. territories with at least one parent born in a different country are considered second generation.
“Third and higher generation” refers to people born in the United States, including Puerto Rico or other U.S. territories with both parents born in the United States, including Puerto Rico or other U.S. territories.


