The two-party system is well-entrenched in American politics. It has been more than half a century since a candidate who was not from the Republican or Democratic Party has won a single state in a presidential election.
Despite, or perhaps because of, the poor recent track record of alternative parties, a sizable minority of Americans are supportive of the idea of having a greater choice of parties.
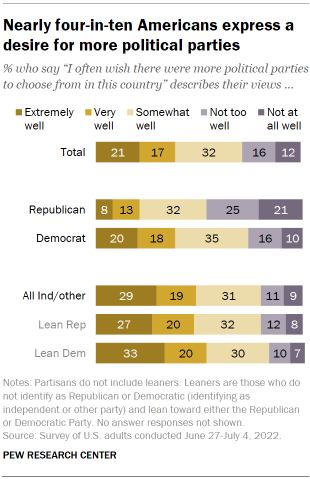
Nearly four-in-ten (39%) say the statement “I wish there were more political parties to choose from in this country” describes their views extremely (21%) or very well (17%). About a third (32%) say it describes their views somewhat well, while 28% say it describes their views not too well (16%) or not at all well (12%).
As might be expected, support for a wider range of parties is greatest among those who do not have strong allegiances to the Republican or Democratic Party.
About half of independents and others not aligned with a party (48%) say wishing they had more parties to choose from describes their views extremely (29%) or very well (19%). Similar shares of Republican-leaning independents (48%) and Democratic-leaning independents (53%) say this is something they would like to see in the U.S.
Among partisans, support for more choice in parties is higher among Democrats than Republicans.
About four-in-ten Democrats (38%) say wishing for more political parties to choose from describes their views extremely or very well, while 21% of Republicans say the same (8% extremely and 13% very). Almost half of Republicans say they do not wish for more political parties in the country (46% say this describes their views not too or not at all well); about a quarter of Democrats (26%) say this.
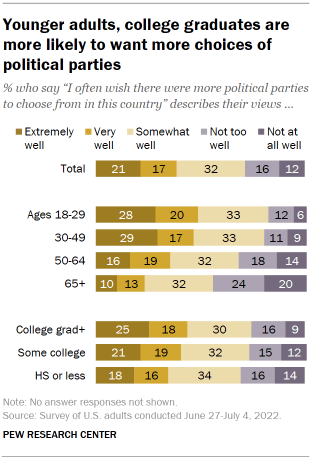
The desire for more political parties to choose from in the U.S. also varies across age groups and by educational attainment.
Younger adults are more likely than older adults to say they wish there were more political parties to choose form in this country. About half of adults ages 18 to 49 (47%) say this sentiment describes their views extremely or very well, compared with 35% of those ages 50 to 64 and about a quarter of adults who are 65 and older (23%).
Americans who have a high school education or less are the least likely to say they would like to have more choices of political parties: Just 34% say wanting more choices describes their views extremely or very well. About four-in-ten of those with some college education (40%) or with a college degree or more (43%) say they would like more parties to choose from.
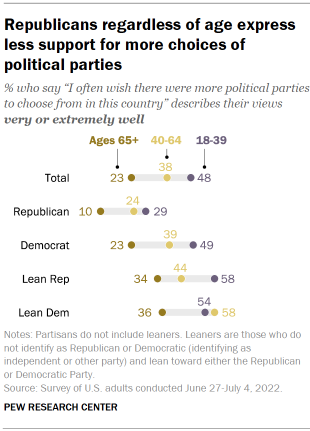
Across partisan groups, younger American adults under age 40 are among the most likely to say they wish there were more political parties to choose from in the U.S., while Americans 65 and older are the least likely to express this opinion.
Overall, about half of adults under age 40 (48%) say they wish there were more political parties to choose from, but that share falls to about three-in-ten among those under age 40 who identify as Republicans (29%). About half or more of these younger adults who are Democrats (49%), lean toward the Democratic Party (54%) or lean toward the GOP (58%) say they wish there were more parties to choose from.
Adults ages 65 and older are generally less likely to express a desire for more parties. Among this age group, more than twice as many Democrats than Republicans indicate support for more parties (23% vs. 10%). Roughly a third of partisan leaners ages 65 and older express this sentiment.
Majority of public sees a great deal of difference between Republican and Democratic parties
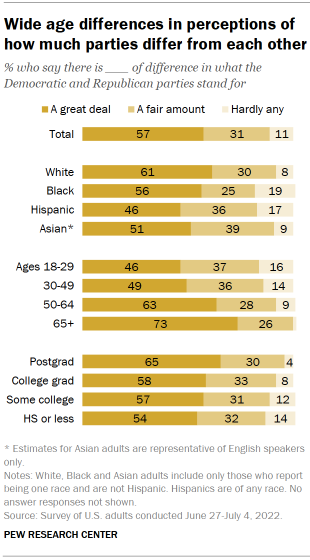
Most Americans (57%) say there is a great deal of difference in what the Republican and Democratic parties stand for, while about a third (31%) say there is a fair amount of difference and 11% say there is hardly any difference at all. These views have changed little since 2019.
Views of differences between the parties vary across racial, ethnic, age and educational lines. The most likely groups to say there is a great deal of difference between the two major parties are White adults, older people and those with postgraduate degrees.
About six-in-ten White adults (61%) say there is a great deal of difference in what the parties stand for, which is somewhat higher than the shares of Black (56%), Asian American (51%) and Hispanic adults (46%) who say that. The shares who say there is hardly any difference between the parties is low across racial and ethnic lines, but Black (19%) and Hispanic (17%) adults are about twice as likely as Asian (9%) and White adults 8% to hold this view.
About three-quarters of adults ages 65 and older (73%) say there is a great deal of difference between Republicans and Democrats, while 63% of those ages 50 to 64 also say this. Only about half of adults ages 18 to 50 (48%) share this position.
There are modest educational differences in these views. Adults with postgraduate degrees (65%) are somewhat more likely than those with less educational attainment to say there is a great deal of difference between what the Republican and Democratic parties stand for.
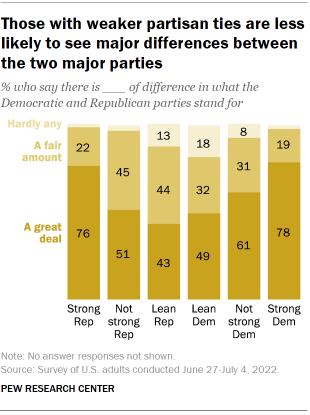
Strong partisans are the most likely to view a great deal of difference between what the Democratic and Republican parties stand for. About three-quarters of strong Republicans (76%) and strong Democrats (78%) say there is a great deal of difference between the parties.
The share who express that view falls to 61% among less strong Democrats and 51% among less strong Republicans. About half of independents who lean toward the Democratic Party (49%) say there is a great deal of difference, while about four-in-ten Republican-leaning independents (43%) say this.
Democratic leaners (18%) and Republican leaners (13%) are the most likely groups to say there is hardly any difference between the parties; few share this view within any of the partisan groups.
Most Americans say at least one candidate for office shares their views
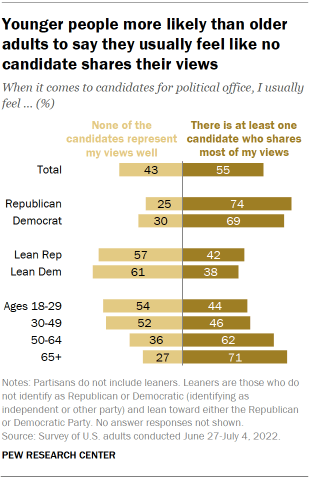
Most Americans say that they usually feel like there is at least one candidate who shares most of their views (55%), while about four-in-ten (43%) say they feel like none of the candidates represents their views well.
Partisans and older adults are the most likely to say they feel like there are candidates who share their views, while partisan leaners and younger adults say there are not candidates who represent their views well.
Seven-in-ten or more Republicans (74%) and Democrats (69%) say there is usually at least one candidate who shares most of their views, compared with fewer than half of Republican (42%) and Democratic leaners (38%).
Among adults ages 18 to 49, 53% say there are usually no candidates that represent their views well, while just 27% of adults ages 65 and older say the same. Most adults 50 and older say they usually have candidates to vote for who share most of their views: 62% of those ages 50 to 64 say this, as do 71% of those 65 and older.
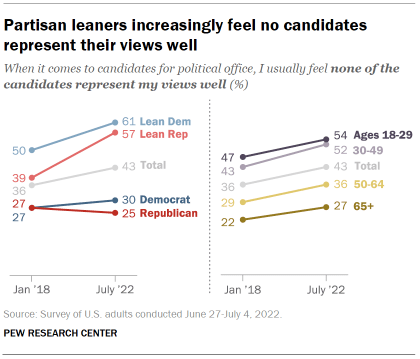
Since 2018, the shares of independents who lean toward a party that say they feel that none of the candidates represents their views well has increased. Among Democratic leaners, the share saying this increased from 50% in 2018 to 61% today, while the share of Republican leaners with the same opinion increased from 39% to 57%. Views among Republicans and Democrats are little changed over that same period.
The feeling that candidates for political office do not represent their views well also has increased across age groups over the past four years. The share who say that none of the candidates represents their views has increased from 47% in 2018 to 54% now among those ages 18 to 29, and from 43% to 52% among those ages 30 to 49. There have been similar increases among older Americans (36% today vs. 29% in 2018 for those ages 50 to 64, and 27% now vs. 22% then for those 65 and older).


