How we did this
Pew Research Center conducted this study to understand Americans’ voting behavior in the 2020 election. Whenever possible, respondents to the survey were presented with the House and Senate candidates that will appear on their ballots by using information about their locations.
Some races do not include candidates of both major parties (for example, a few districts in California have two Democratic and no Republican candidates). Excluding these handful of races where there are not two major party candidates running does not meaningfully impact the conclusions of this report, but they have been included in the analyses presented here.
Everyone who took part in this survey is a member of Pew Research Center’s American Trends Panel (ATP), an online survey panel that is recruited through national, random sampling of residential addressees. This way nearly all U.S. adults have a chance of selection. The survey is weighted to be representative of the U.S. adult population by gender, race, ethnicity, partisan affiliation, education and other categories. Read more about the ATP’s methodology.
Here are the questions used for the report, along with responses, and its methodology.
In an era of increasing partisanship, split-ticket voting continues to be rare in U.S. politics. With control of the Senate at stake on Nov. 3, just 4% of registered voters in states with a Senate contest say they will support Donald Trump or Joe Biden and a Senate candidate from the opposing party.
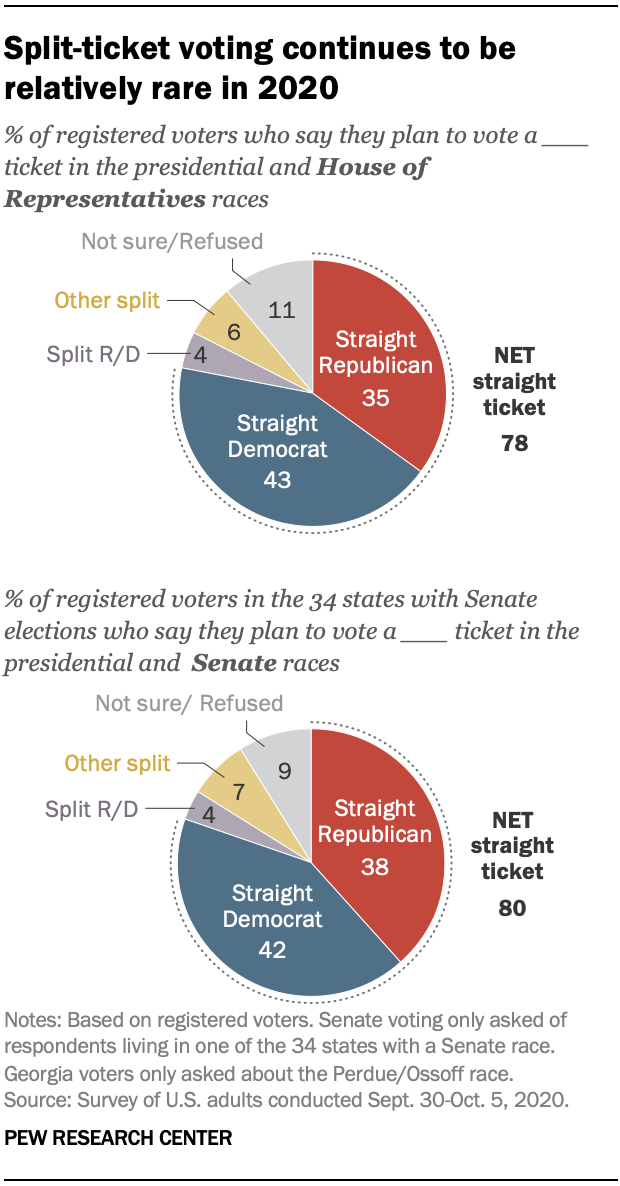
In voting for both the House and Senate, partisanship prevails. About eight-in-ten of voters (78%) say they will vote (or already have voted) for either Biden and the Democratic House of Representatives candidate (43% of all voters) or Trump and the Republican candidate (35% of all voters) in their congressional district.
Only 4% of registered voters say they plan to vote for Biden and the Republican candidate for House in their district or Donald Trump and the Democratic House candidate. This is little changed from four years ago. It is more common for voters to say they plan to vote for a third-party candidate for president (or less commonly, for the House) and a major-party candidate for the other race. Still, only 6% of voters say they plan to cast their ballots this way.
Similarly, among those living in states with Senate races, the largest share of voters say they plan to vote for both Biden and the Democratic Senate candidate (42%) or Trump and the Republican Senate candidate (38%) in their state. A recent analysis of U.S. Senate elections since 2012 shows how rare it is for a Senate race to go a different way from a state’s votes in presidential elections. In 139 regular and special elections for the Senate since 2012, 88% have been won by candidates from the same party that won that state’s most recent presidential contest.
This analysis of split-ticket voting is based on Pew Research Center’s recent national survey, conducted Sept. 30 to Oct. 5 among 11,929 U.S. adults, including 10,543 registered voters in which Biden garners support from 52% of registered voters and Trump is supported by 42%. The survey used information about respondents’ locations to present survey-takers with the names of the candidates running in each congressional race.
Modest demographic differences in split-ticket voting
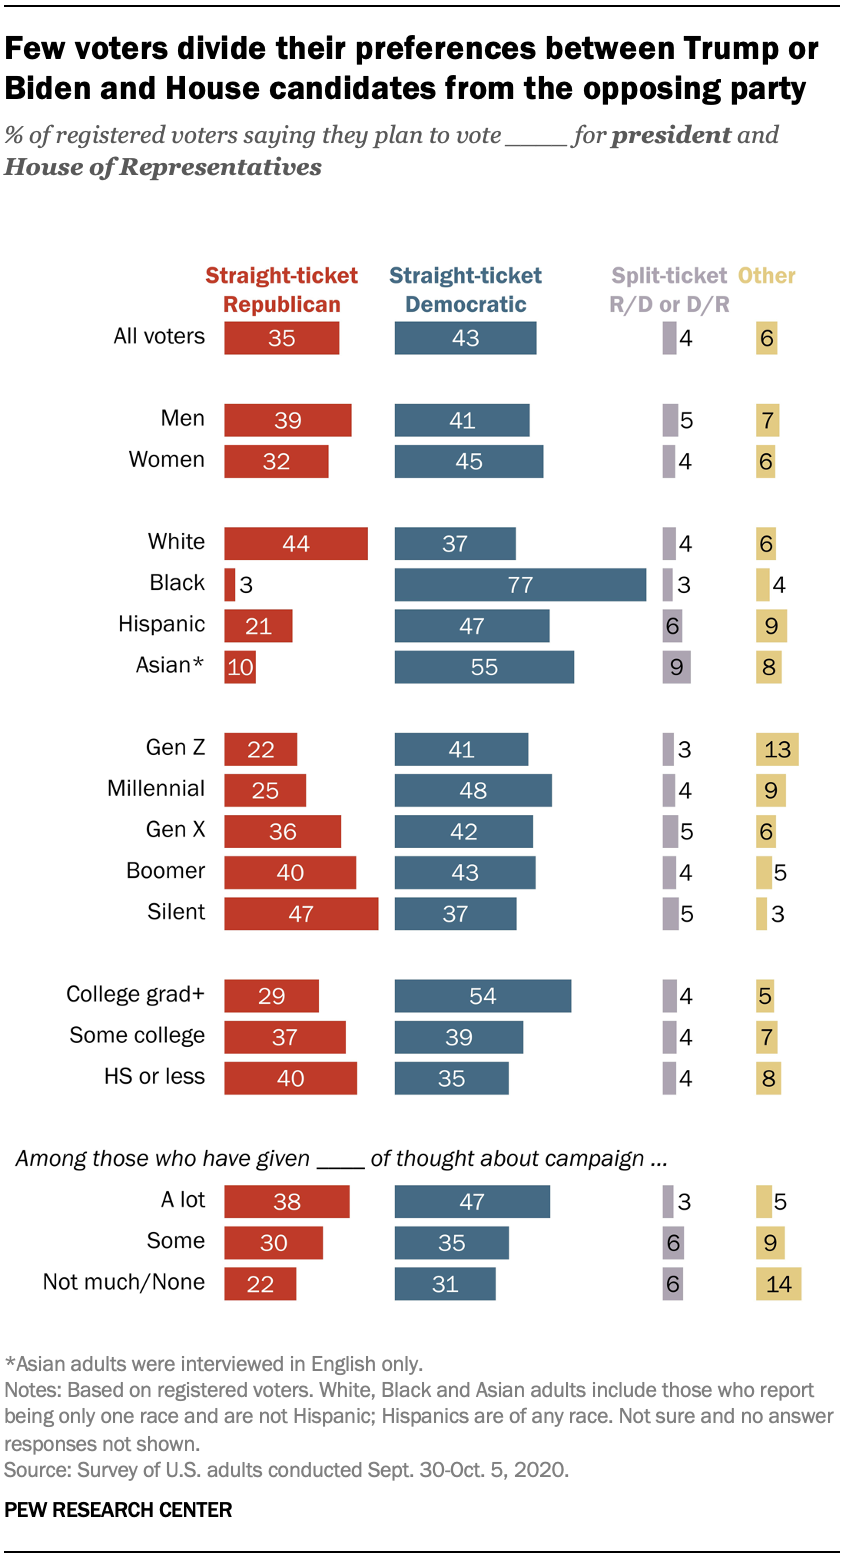
Majorities of every major demographic group in the electorate are voting for the same party’s candidate in the presidential election and the congressional election in their district. The share of voters in any major demographic group that casts a ballot for both a Republican and a Democratic candidate in these elections is usually less than 5% across major demographic groups.
Straight-ticket voting mirrors presidential voting patterns. Men are more likely than women to vote for Republican candidates in both the House and presidential elections, while women are more likely to support Democratic candidates in both.
White voters are substantially more likely than voters of other racial and ethnic backgrounds to vote for Republican candidates in both the congressional and presidential elections.
The share of voters casting a straight-ticket Republican ballot in these elections increases steadily with age. Only 22% of Gen Z voters are voting this way, compared with nearly half (47%) of Silent Generation voters.
Gen Z and Millennial voters are also more likely than voters in older generations to support third- or fourth-party candidates for president; 13% of Gen Z voters favor non-major party candidates for either House or president, as do 9% of Millennial voters. Thus, larger shares of voters in these generations split their votes for president and the House. But just 3% of Gen Z voters and 4% of Millennials favor Biden and a Republican House candidate or Trump and a Democrat. That is comparable to the shares of older voters who divide preferences on a partisan basis in voting for president and the House.
Voters with a bachelor’s degree or more education are much more likely to vote a straight Democratic ticket in these races than are those with less education. There is no relationship between education and Republican-Democratic split-ticket voting; equal shares of voters (4%) across different levels of educational attainment vote this way.
Lower-engagement voters – those who say they have given less than “a lot” of thought to the presidential race – are more likely than others to split their tickets between the Republican and Democratic candidates in the presidential and congressional elections in their districts, though it is still very uncommon (6% of lower-engagement voters vs. 3% of those who are paying a lot of attention to the race).
These lower-engagement voters are much more likely to support minor-party candidates in either the presidential race or the congressional race in their district (14% of those who are paying less than “some” attention to the race vs. 5% of those who are paying “a lot” of attention).
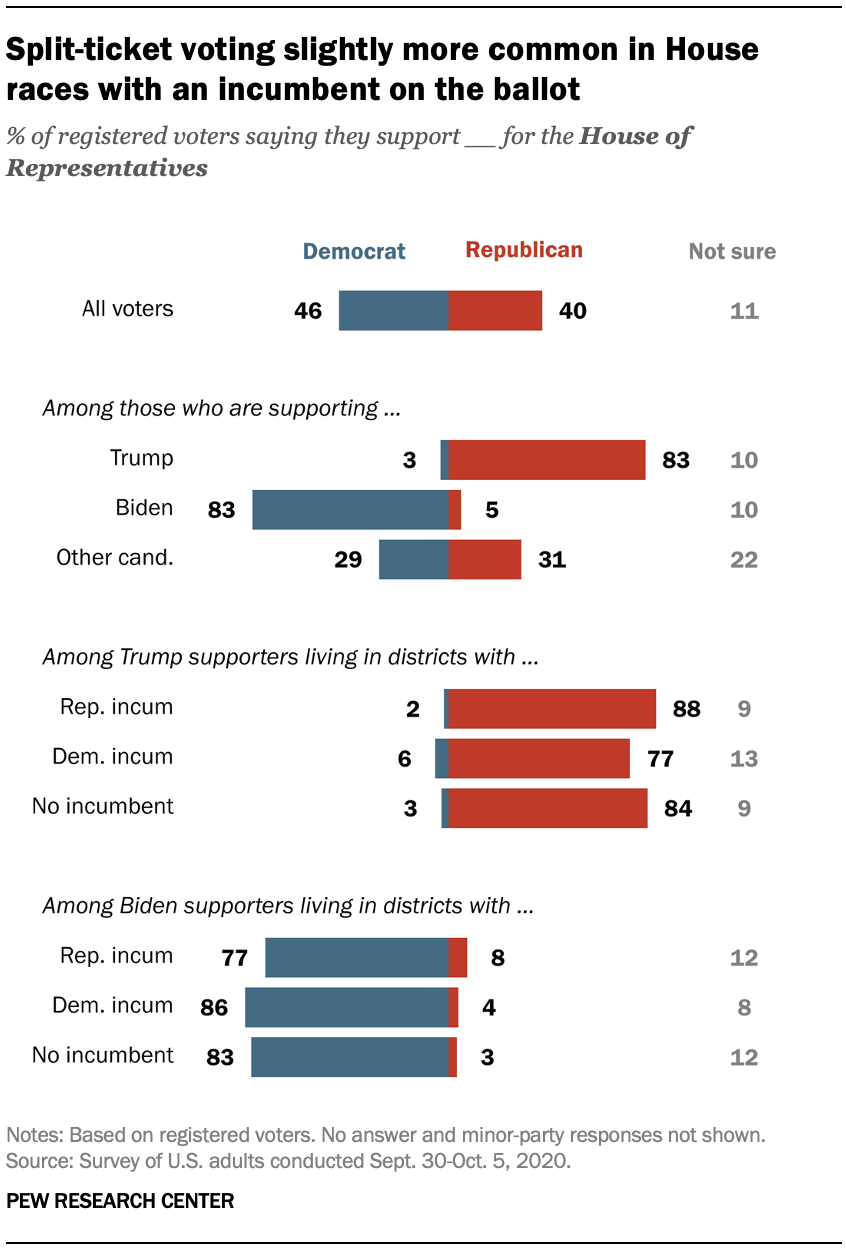
Among all registered voters, Democrats hold an edge in congressional elections, with 46% of voters saying they will vote (or have already voted) for the Democratic candidate in their district and 40% saying they support the Republican candidate. About one-in-ten voters (11%) are not sure whom they will support.
Trump voters and Biden voters overwhelmingly say they support the same party’s candidate for the congressional race in their district (83% of each say they will support a candidate of the same party). Voters who support minor-party candidates for president are about evenly divided in their vote for the House of Representatives (29% support the Democrat and 31% support the Republican).
Trump supporters and Biden supporters living in districts with an opposite-party incumbent are slightly more likely to split their tickets than those living in districts with a same-party incumbent or an open-seat contest. Trump supporters in districts with Democratic incumbents and Biden supporters in districts with Republican incumbents are also more likely than those with same-party incumbents to say they are undecided in the congressional race.
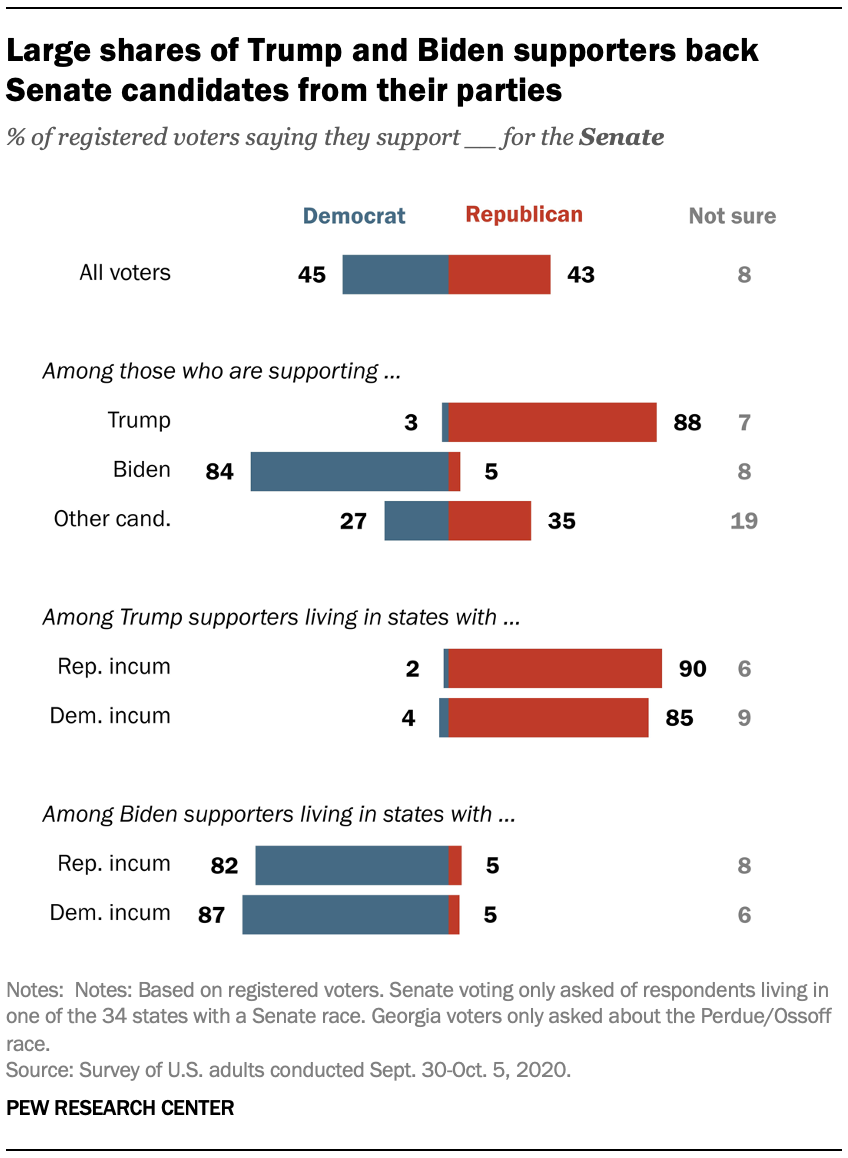
Overall in states where there is a Senate contest, support for Senate candidates is roughly evenly divided. The share of voters supporting the Democratic candidate (45%) in their state is similar to the share supporting the Republican candidate (43%), and 8% of voters say they aren’t sure at this point whom they will support.
Similar to the elections for the House of Representatives, overwhelming shares of voters who are supporting Trump (88%) and Biden (84%) say they are also supporting the same-party candidate for Senate, while those who are supporting a minor-party candidate are more divided (27% support the Democratic candidate in their state and 35% support the Republican candidate).
Unlike in the House elections, there is less evidence that incumbency has any effect on split-ticket voting in these higher-profile Senate races.
