The COVID-19 outbreak has presented a unique set of measurement challenges for statistical agencies. Most recently, the Bureau of Labor Statistics (BLS) reported that the U.S. unemployment rate stood at 13% in May 2020, nonseasonally adjusted. At the same time, the bureau noted that the rate may have been as high as 16% if not for an error in the classification of the employment status of certain workers. Many workers not at work due to COVID-19-related business closures were classified as “employed but absent from work” instead of “unemployed on temporary layoff.”
How we did this
The COVID-19 recession, barely three months old, has had a sharp and severe impact on unemployment among American workers. The coronavirus outbreak has also affected data collection efforts by the U.S. government, potentially understating the true extent of unemployment. This analysis describes how the underestimation of unemployment varied among major demographic groups of workers.
The unemployment rate is the number of jobless workers actively seeking work as a share of workers either at work or actively seeking work. In April and May 2020, there was a sharp rise in workers classified as being “employed but absent from work for other reasons.” Many of these workers should have been counted as “unemployed on temporary layoff,” according to the U.S. government.
The estimates of the “official” and “adjusted” unemployment rate in this analysis are derived from the Current Population Survey (CPS). The CPS is the government’s official source for monthly estimates of unemployment. The “official” estimates are based on the definition used by the government in its published estimates. The “adjusted” unemployment rate includes workers listed as “employed but absent from work for other reasons” in May, less the number of workers so listed in February. The underlying assumption is that the number of workers listed as employed but absent from work for other reasons in February – at the start of the COVID-19 recession – approximates the normal count of these absentees. All estimates are nonseasonally adjusted.
The COVID-19 outbreak has also led to about a 10 percentage point decrease in the response rate for the CPS in March and April 2020 and an even greater decrease in May 2020. It is possible that some measures of unemployment and its demographic composition are affected by these changes in data collection.
In May, 8.3 million workers were classified as employed but absent from work in government data. For some workers, reasons for being absent from work included vacations, illnesses, maternity leave and the like. For nearly two-thirds – 5.4 million workers – the reason for absence from work was recorded as “other,” a number sharply higher than the norm. In February, at the start of the COVID-19 recession, only 600,000 workers were absent from work for other reasons. If the additional 4.8 million workers placed in this category in May were instead listed as unemployed on temporary layoff, the overall unemployment rate would have been 16%, not 13% as officially recorded.
The undercount of unemployment was greater for women than for men. For women, the unemployment rate in May would have been 17.8% instead of the reported 14.3%, an increase of more than 3 percentage points if adjusted for the misclassification error. For men, the adjusted unemployment rate in May would have been 14.5%, not 11.9%, an increase of less than 3 points.
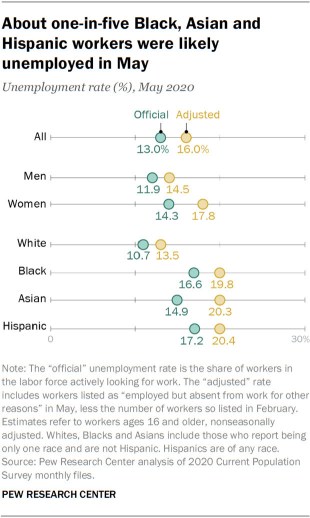
Among racial and ethnic groups, the unemployment rate for Asian workers may have been as high as 20.3% in May. That would have put them on par with Black (19.8%) and Hispanic (20.4%) workers, compared with an adjusted rate of 13.5% for white workers. Notably, the unemployment rate among Asian workers in February was only 2.5%, significantly less than the rate for Hispanic (4.8%) and Black (6.2%) workers.
The experience of Asian workers in the COVID-19 recession stands in contrast to their experience in the Great Recession, when their unemployment rate peaked at a level well below the rates for Black and Hispanic workers. In the current downturn, job losses have been concentrated in the leisure and hospitality sector. While this sector accounted for 11% of total nonfarm employment in February, it accounted for 35% of the total loss in jobs from February to May. Asian, Black and Hispanic workers were about equally likely to be employed in this sector prior to the COVID-19 outbreak.
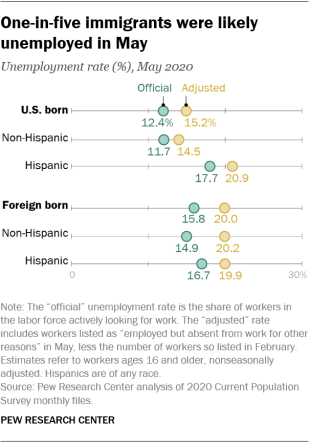
For immigrant workers, adjusting for the misclassification pushes the unemployment rate to 20.0% in May, compared with the official estimate of 15.8%. The bulk of the adjustment is in the employment status of non-Hispanic immigrant workers, whose unemployment rate rises from 14.9% to 20.2%, a correction of more than 5 percentage points. Following adjustment, the unemployment rate among Hispanic workers, U.S. born or foreign born, is also about 20% or higher in May. The adjusted rate among U.S.-born non-Hispanic workers (14.5%) is much lower than among U.S.-born Hispanic workers.
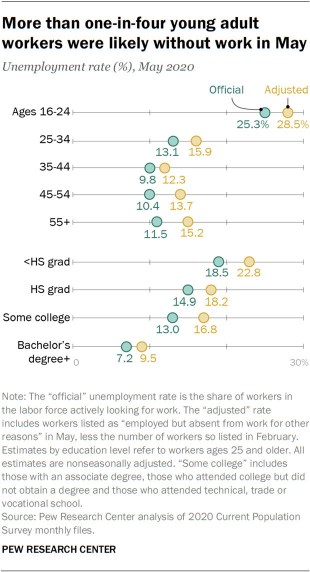
The unemployment rate for young adult workers, ages 16 to 24, stood at 28.5% in May, following correction, and the adjusted rate for older workers ranged from 12.3% among workers ages 35 to 44 to 15.9% among workers 25 to 34. The extent of the correction ranged from 2.4 percentage points for workers ages 35 to 44 to 3.7 points for workers 55 and older.
Correcting for the measurement error causes a relatively sharp rise in the unemployment rate for workers without a high school diploma, from 18.5% to 22.8% in May. Also, nearly one-in-five workers (18.2%) with a high school diploma only and 16.8% of workers with some college education were likely unemployed in May. Only workers with a bachelor’s degree or higher education maintained an unemployment rate in the single digits (9.5%) following the correction for the misclassification.
The measurement error in the unemployment rate was even greater in April, when the adjusted unemployment rate stood at 19.2% compared with the official rate of 14.4%, record highs in either event in the post-World War II era. Following adjustment, the unemployment rate in April was notably high among workers ages 16 to 24 (32.2%), those without a high school diploma (27.9%), Hispanic workers (24.3%), immigrants (23.5%) and women (20.7%). Unemployment rates similar to these levels were last observed in the Great Depression of the 1930s, when the unemployment rate is estimated to have peaked at about 25%.