Some of this report is based on the findings of a national survey on Americans’ use of the internet and computer logs of how people use Facebook as provided by Facebook, Inc.
Facebook logs data: To obtain computer logs of Facebook usage, at the end of our survey participants were asked if they would volunteer to allow Facebook to share computer logs of their use of the Facebook service. Participants who agreed volunteered their email address to be matched with Facebook computer logs. A total of 269 survey respondents gave permission for Facebook to provide data on their use of the service. This represents 12% of those who agreed to participate in the national survey. In some cases, where noted in our analysis, Facebook was not able to generate specific measures for all participants and the number of cases may be lower.
Survey methodology: The survey results in this report are based on data from telephone interviews conducted by Princeton Survey Research Associates International from October 20 to November 28, 2010, among a sample of 2,255 adults, age 18 and older. Interviews were conducted in English. A combination of landline and cellular random digit dial (RDD) samples was used to represent all adults in the continental United States who have access to either a landline or cellular telephone. Both samples were provided by Survey Sampling International, LLC (SSI) according to PSRAI specifications. Numbers for the landline sample were selected with probabilities in proportion to their share of listed telephone households from active blocks (area code + exchange + two-digit block number) that contained three or more residential directory listings. The cellular sample was not list-assisted, but was drawn through a systematic sampling from dedicated wireless 100-blocks and shared service 100-blocks with no directory-listed landline numbers. The final data also included callback interviews with respondents who had previously been interviewed for 2008 Personal Networks and Community survey. In total, 610 callback interviews were conducted – 499 from landline sample and 111 from cell sample.
A new survey sample was released daily and was kept in the field for at least five days. The sample was released in replicates, which are representative subsamples of the larger population. This ensures that complete call procedures were followed for the entire sample. At least 7 attempts were made to complete an interview at a sampled telephone number. The calls were staggered over times of day and days of the week to maximize the chances of making contact with a potential respondent. Each number received at least one daytime call in an attempt to find someone available. The introduction and screening procedures differed depending on the sample segment. For the landline RDD sample, half of the time interviewers first asked to speak with the youngest adult male currently at home. If no male was at home at the time of the call, interviewers asked to speak with the youngest adult female. For the other half of the contacts interviewers first asked to speak with the youngest adult female currently at home. If no female was available, interviewers asked to speak with the youngest adult male at home. For the cellular RDD sample, interviews were conducted with the person who answered the phone. Interviewers verified that the person was an adult and in a safe place before administering the survey. For landline or cell callback sample, interviewers started by asking to talk with the person in the household who had previously completed a telephone interview in the 2008 survey. The person was identified by age and gender. Cellular sample respondents were offered a post-paid cash incentive for their participation. All interviews completed on any given day were considered to be the final sample for that day.
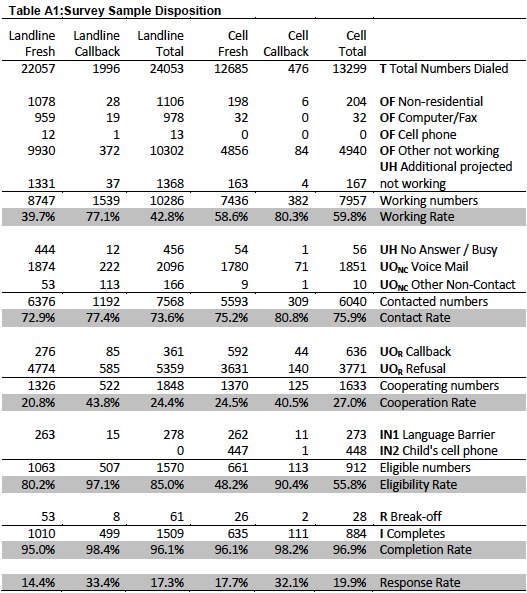
The disposition reports all of the sampled telephone numbers ever dialed from the original telephone number samples. The response rate estimates the fraction of all eligible respondents in the sample that were ultimately interviewed. At PSRAI it is calculated by taking the product of three component rates:
- Contact rate – the proportion of working numbers where a request for interview was made
- Cooperation rate – the proportion of contacted numbers where a consent for interview was at least initially obtained, versus those refused
- Completion rate – the proportion of initially cooperating and eligible interviews that were completed
Thus the response rate for the landline sample was 17.3 percent. The response rate for the cellular sample was 19.9 percent.
Following is the full disposition of all sampled telephone numbers:
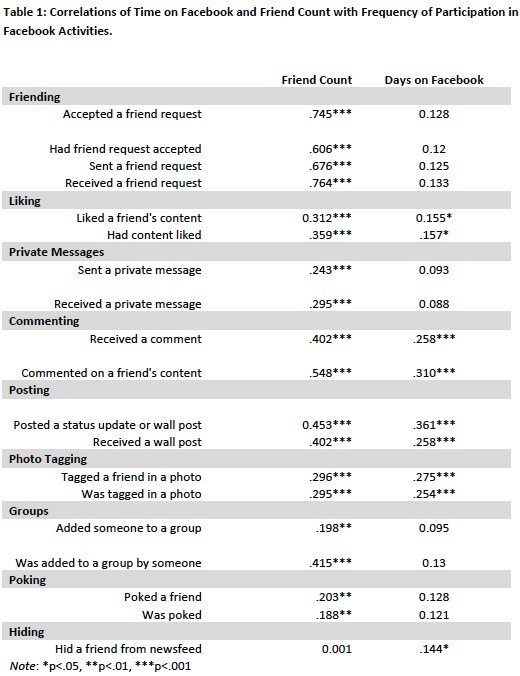
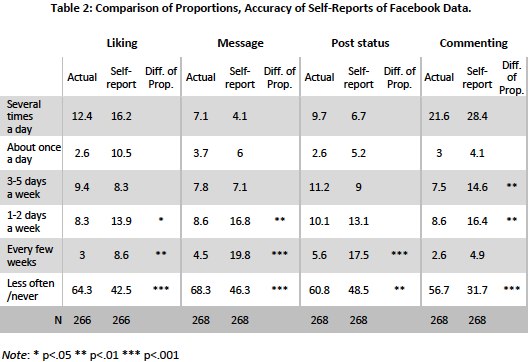
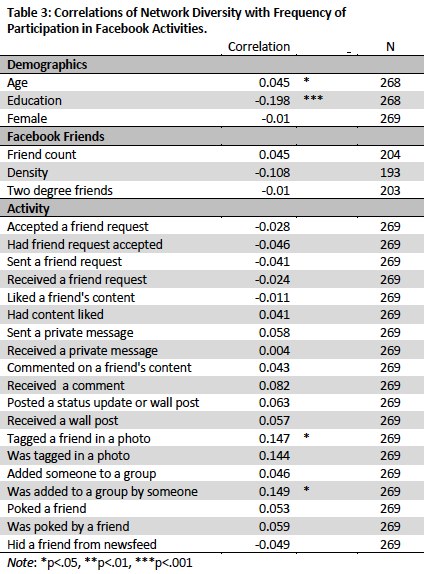
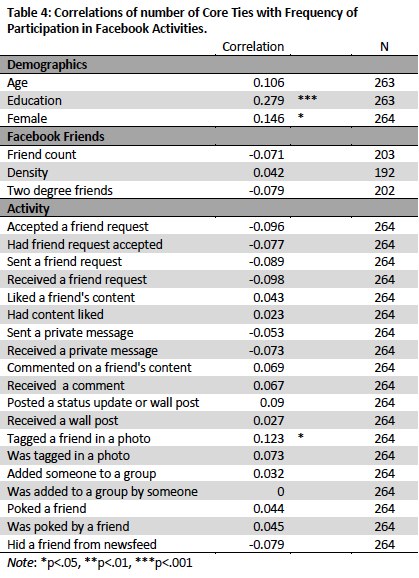
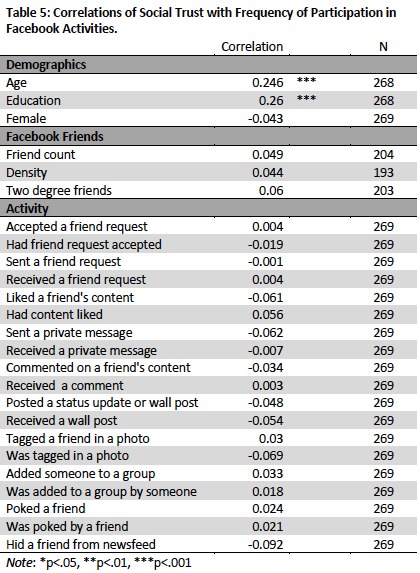
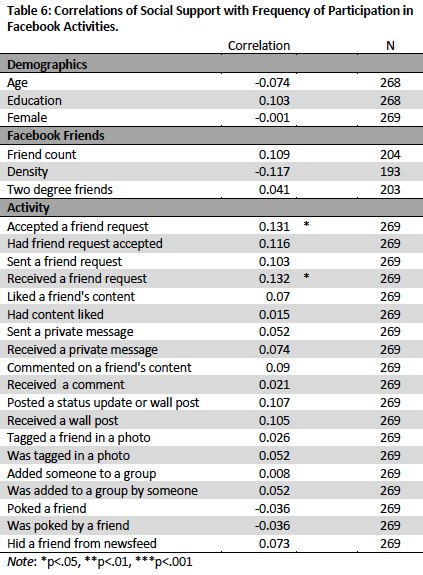
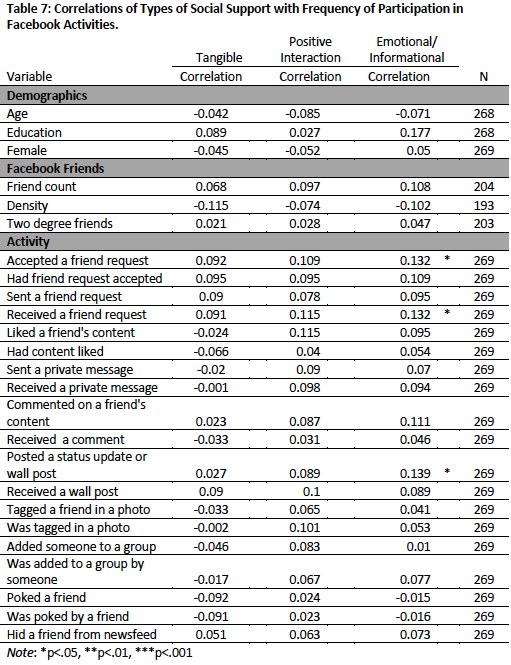
Appendix A: Additional Tables