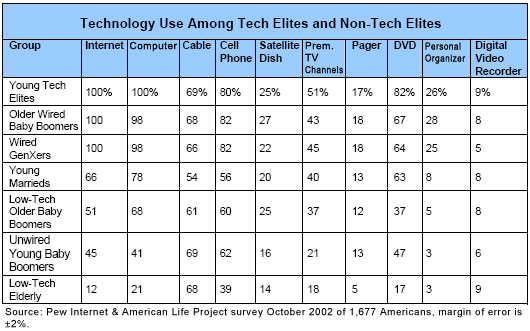
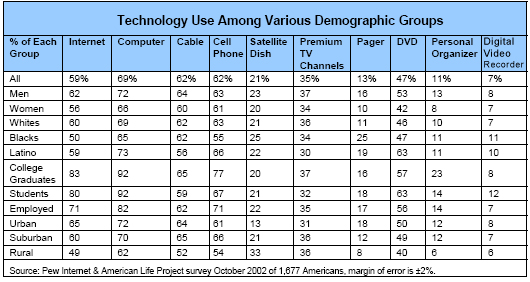
This appendix provides detail on monthly spending and overall penetration rates of information goods and services surveyed by the Pew Internet & American Life Project in October 2002. This includes monthly spending data for selected demographic groups, and also data on penetration rates for the six of the seven groups of users identified in the report and by selected demographic groups.11
The table below shows how different demographic groups break down when it comes to average monthly spending on information goods and services, both in total and for specific items. In reading the table, it is important to recognize that the column labeled “Total Spent on Information Goods and Services” is a weighted average. That is, it reflects the total of the six columns to the right, adjusting for the fact that not all people pay for cable, cell phones, Internet, or some of the other items. For individual services listed, the dollar figure represents monthly spending estimates for those people who have the particular service. Thus, the sum of the six columns of specific items significantly exceeds the weighted average.
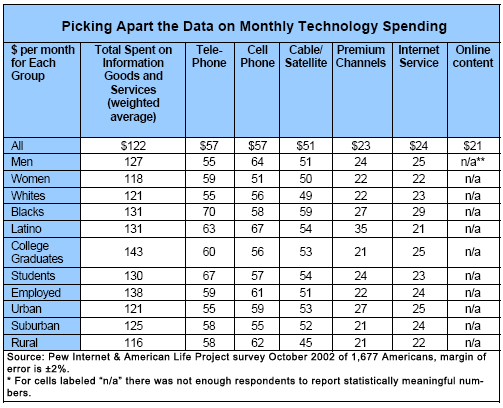
Several surprises emerge upon looking at the data. First, it may come as a surprise that blacks and Latinos pay, on average, more per month in the selected categories than whites. For blacks, the extra spending is devoted to the telephone, cable TV (including premium channels), and Internet access. It is hard to pinpoint the reasons for this, although looking at “old media” habits, it seems that blacks are more dependent than other segments of the population on electronic means. They are a bit more likely than others to get news from TV on a typical day than others and less likely to read a newspaper. It is also notable that students pay more per month on selected information goods and services; since many may live away from home, long distance telephone calls may be the source of the difference.
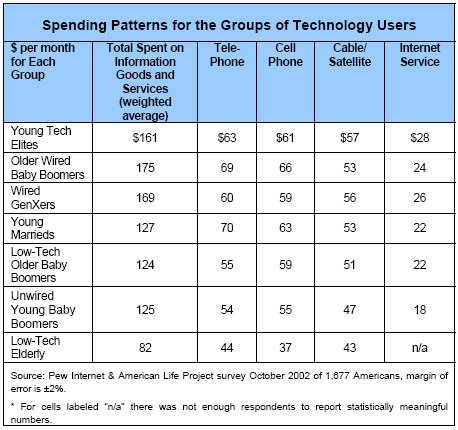
As noted in the body of the report, there are considerable spending variations among the groups of technology users identified. The Young Tech Elites spend on average $161 per month on the selected items, while the Older Wired Baby Boomers spend $175 per month. On the other end of the spectrum, the Young Marrieds, with a modest amount of technology, spend $127 per month and the aging baby boomers with relatively little technology spend $124 per month. The table below presents spending for the groups identified in this report, with the monthly total and for each technology. The table is like the one above in that the “total” column is a weighted average, and the figures for specific technologies are only for those users who had the particular item. Not all totals are reported because of the small number of responses in some instances, and online content and cost of premium TV channels totals by group are not reported for that reason.
We also sought to get at the source of the variations in spending across the groups and used regression analysis to do this. This analysis was performed to see how demographic factors independently influence spending on the sum of the six information goods and services chosen. If, as we know, the Young Tech Elites spend more on average than other people, is it due to something inherent in their classification as a “Young Tech Elites,” or is it because of other factors, such as age, education, or race? In other words, do the Young Tech Elites spend more because of something about them that is independent of their levels of income or education, or other demographic factors?
The results suggest that the most technologically sophisticated in the population – the Young Tech Elites, Wired GenXers, and the Older Wired Baby Boomers – have a preference for spending in the six categories of information services that is independent of other socioeconomic factors. In other words, something about these two groups of technological sophisticates drives them to spend more on information services. We do not know what the “something” is, but we know that this extra spending occurs irrespective of income, education, age, or race. Additionally, several variables have the expected impacts on spending; income has a positive and significant impact on spending, as does being a parent. Age (being over age 55) and being white were associated lower levels of spending; by contrast, being black was associated with higher spending in the six categories. Other classifications of users (e.g., Unwired Young Baby Boomers or Young Marrieds) did not independently impact monthly spending.