This report is based on the findings of a survey of Americans about their use of the Internet. The results are based on data from telephone interviews conducted by Princeton Survey Research Associates between January 29 and February 20, 2002, among a sample of 507 Internet users, 18 and older, who have broadband Internet access. For results based on the total sample, one can say with 95% confidence that the error attributable to sampling and other random effects is plus or minus 4 percentage points. In addition to sampling error, question wording and practical difficulties in conducting telephone surveys may introduce some error or bias into the findings of opinion polls.
Interviews for this survey were completed from a pre-screened sample of Internet users who in past surveys identified themselves as having broadband Internet access. Once the household was reached, interviewers asked to speak with the individual who had recently completed a telephone survey. Once the targeted person was on the phone, they were asked a few screening questions to make sure that they still had high speed Internet access at home.
At least 10 attempts were made to complete an interview at every household in the sample. The calls were staggered over times of day and days of the week to maximize the chances of making contact with a potential respondent. Interview refusals were re-contacted at least once in order to try again to complete an interview.
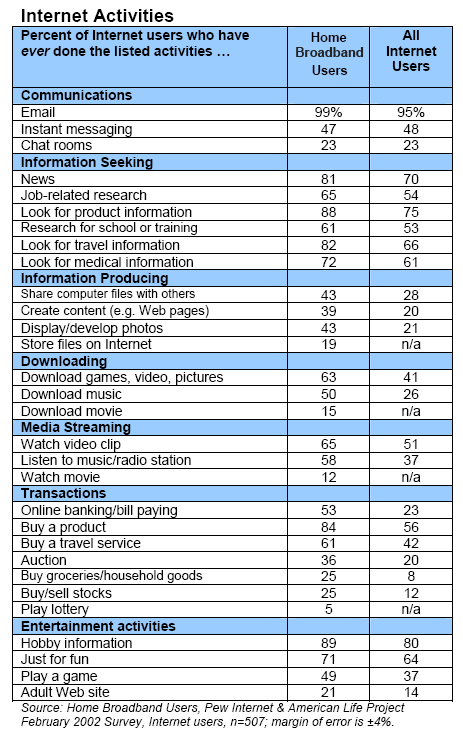
Appendix A: Internet Activities
Appendix B
In this report’s section “Changes in behavior: Broadband access is a decisive factor”, we discuss some of the causal factors underlying our finding that home broadband access makes the key difference for the surfing habits of high-speed users. This appendix elaborates on the statistical techniques employed that are the basis for that finding. We used regression analysis, a statistical technique that isolates the independent effects of various factors (e.g., demographics or a home broadband connection) to examine what drives the intensity of home Internet use.
The analysis assesses the intensity of users’ online behavior by looking at three variables:
- the likelihood that someone answers “yes” to the question “Did you go online yesterday?”
- the amount of time spent online during a typical day
- how many activities he performs on a typical day online
The table below summarizes the results from the regression analysis, which examined the traits or outside forces that might influence people’s Internet use. The horizontal rows contain the independent variables—the factors we seek to explain—and the vertical rows contain the dependent variables—the things that may explain the observed outcomes (e.g., going online on a daily basis). The explanatory variables are the things that might conceivably affect the intensity of someone’s Internet use: a home broadband connection, number of years online, age, income, education gender, and race.
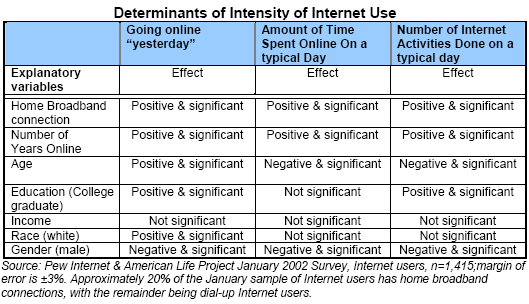
For “going online yesterday”, the dependent variable is binary (i.e., coded as 1 for those who answer “yes”) and logistic regression is used in the analysis. For the amount of time spent online on a given day, we asked users to estimate the amount of time they spend online. Those who say they spend more than 2 hours online per day are coded as 1, and those who spend less than 2 hours are coded as 0 for the purposes of a logistic regression. The number of activities done on a typical day is a continuous variable, with ordinary least squares used in the regression analysis.
The results show that having a home broadband connection, number of years online,3 and gender are the only factors that explain intensity of Internet use consistently in all three specifications. Although numbers are not reported, having a home broadband is the largest single factor that explains going online daily, spending two or more hours online daily, or doing a greater number of Internet activities. For the logistic regressions, exponentiated coefficients allow us to compare the relative magnitudes of the predictive power of significant variables. For the ordinary least squares regression, the fact that having a broadband connection, number of years online, and gender are all “dummy” variables permits comparison of the relative magnitudes of variables’ explanatory power.
In short, having a home broadband connection and having been online for a long time both increase your chances of using the Internet intensively. But the home broadband connection increases your chances more.


