The Growth of Hispanics
Census Bureau estimates indicate that the Hispanic population grew by 10.2 million from 2000 to 2007. The increase in the Hispanic population was quite widespread: Of 3,141 counties across the U.S., the Hispanic population increased in 2,991.
Though widespread, the increase in the Hispanic population has nonetheless been fairly concentrated. This is underscored three ways.
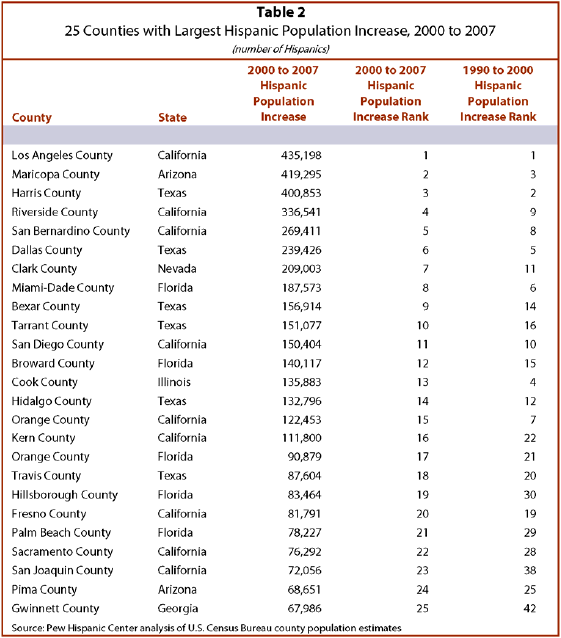
First, the 40 counties with the largest Hispanic population increases since 2000 account for half (5.1 million) of the total 10.2 million increase in the nation’s Hispanics. These 40 counties tend to be the ones with the largest Hispanic populations (Table 1). A county’s Hispanic population size is highly associated with a county’s Hispanic population gain (measured in absolute terms) (Table 2). As discussed shortly, in 2000 the Hispanic population was fairly geographically concentrated, so the Hispanic population gains have been fairly concentrated.

Second, 178 counties experienced an increase in their Latino population of at least10,000, and the growth in the Hispanic population in those 178 counties account for 79% of the total 10.2 million increase in the nation’s Hispanic population. Map 1 portrays counties by the size of their Hispanic population increase since 2000.
Third, virtually all (99%) of the nation’s Hispanic population lives in the 1,362 (out of 3,141) counties that had at least 1,000 Hispanic residents in 2007. The Hispanic population increased by 10.0 million in these counties since 2000, accounting for virtually all (98%) of the growth in nation’s Hispanic population in this decade.
Dispersion of Hispanics
One of the most prominent features of the growth of Hispanics since 1990 has been the dispersal of Hispanics to new destinations (Durand, Telles and Flashman, 2006; Suro and Singer, 2002). As many county supervisors and school districts know, there are now many Hispanics residing in counties that until 1990 had small Hispanic populations.3 This pattern, which took hold in the 1990s, has continued in the new century. Though Latinos remain highly concentrated in a subset of large counties, they are slightly less concentrated now than in 2000. Dispersal continues.
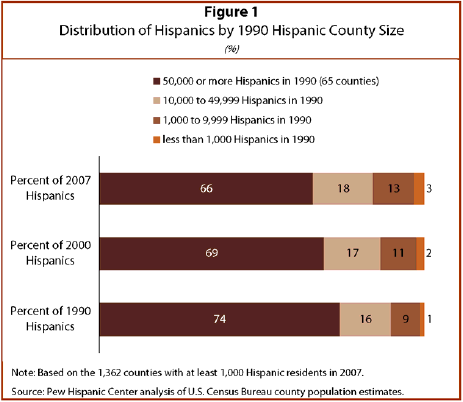
In 1990, 74% of Hispanics resided in 65 counties that had at least 50,000 Hispanics (Figure 1). By 2000, 69% of the total Hispanic population resided in these 65 counties. Since 2000, those 65 counties have continued to have a diminishing share of the Latino population: In 2007, they were home to just 66% of the Hispanic population.
Similarly, in 1990, 90% of the Hispanic population lived in the 220 counties that had at least 10,000 Hispanics residents. In 2000, those same 220 counties had 87% of the nation’s Hispanic population; by 2007, it was 84%.


