An analysis of changes in employment by occupation shows that Latino and non-Latino workers were moving on different paths in the labor market in 2004. While the two groups of workers tended to gain and lose jobs in the same industries, there is a considerable gap in the kinds of work in which they are engaged. Employment gains for non-Hispanics in 2004 were fed by the rising demand for workers in higher-skill occupations requiring at least some college education. But new jobs for Hispanic workers, mostly filled by recently arrived immigrants, were concentrated in relatively low-skill occupations calling for little other than a high school education. As shown in the final section, the concentration of Latinos in lower skill occupations has also contributed to declining wages for them over the past two years.
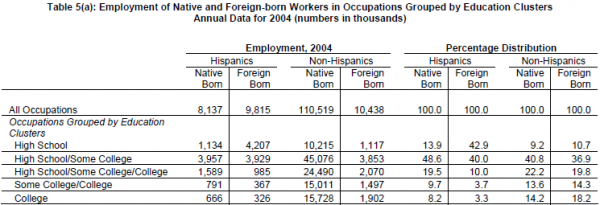
Table 5(a) shows the distribution of Latino and non-Latino workers across occupations classified into five clusters. These clusters are based on the levels of education required for most workers to become fully qualified for work in an occupation.9 Over 80 percent of workers in the typical occupation in the “high school” cluster have a high school education or less. Examples of such occupations are maids and housekeeping cleaners, grounds maintenance workers, dishwashers, construction laborers, and miscellaneous agricultural workers. Conversely, occupations in the “college” cluster are almost entirely populated by workers with a four-year college or higher level of education. These are occupations such as accountants and auditors, computer software engineers, medical scientists, lawyers, and post-secondary teachers. In between these two clusters are three occupational clusters calling upon a mix of education levels.
Almost all foreign-born Hispanic workers were employed in the two lowest-skill-level occupations in 2004. As shown in Table 5(a), 82.9 percent of immigrant Latino workers were engaged in work calling for either a high school or some college level of education, where some college refers to less than four years of college.10 The same is true for nearly two-thirds of native-born Latino workers. However, less than one-half of non-Hispanic workers work in the two lowest rungs of occupations grouped by skill. At the other end of the ladder, fewer than 10 percent of immigrant Latinos, but one-third of foreign-born non-Hispanic workers, are employed in occupations calling for some college or a four-year college education.
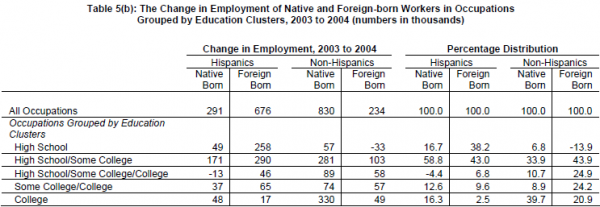
Changes in employment between 2003 and 2004 show that Latinos and non-Latinos were on different paths and filled different needs in the labor market. More than 80 percent of the new jobs for immigrant Hispanics and 76 percent of the new employment for native-born Hispanics were in the two lowest-skill-level occupational clusters (see Table 5(b)). To a large extent, this reflects the age, education and nativity of the Hispanic labor force. In contrast, 45 to 50 percent of the newly employed non-Hispanic workers, native or foreign born, were hired into the two highest-skill-level occupational clusters. The figure is even greater for native-born white workers—64 percent of the new jobs for them were in occupations at the highest rungs of training and education requirements (data not shown in table). These disparate trends in employment suggest that the occupational clustering of Hispanic and non-Hispanic workers is likely to continue in the coming years.