A majority of U.S. adults say the decreasing share of Americans who identify their race as White is neither good nor bad for society, according to a recent Pew Research Center survey.
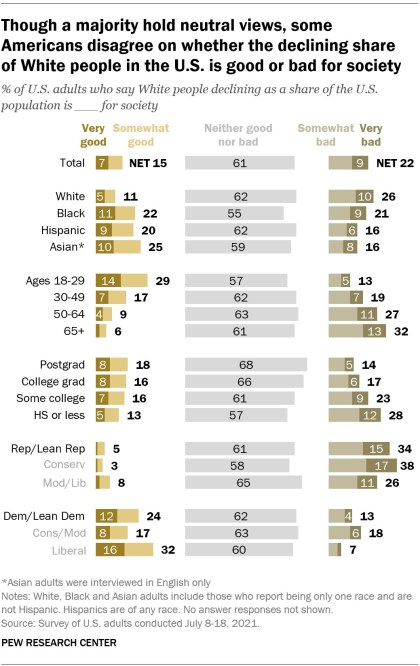
About six-in-ten adults (61%) say the declining proportion of Americans who identify as White – a trend documented this month in new data from the Census Bureau about Americans who identify as solely White and not Hispanic – is neither good nor bad for society. About two-in-ten (22%) say it is bad, including 9% who say it is very bad. Slightly fewer (15%) say it is good for society, including 7% who say it is very good, according to the survey of 10,221 adults, conducted July 8-18, 2021.
Majorities across demographic and political groups have neutral views about the changing racial makeup of the U.S. population. But there are substantial differences in the shares who have a positive or negative opinion about the declining proportion of White people in the country.
Pew Research Center conducted this study to understand the public’s views on the declining share of Americans who identify as White, a decades-long trend that has accelerated in recent years. For this analysis, we surveyed 10,221 U.S. adults in July 2021. Everyone who took part in this survey is a member of the Center’s American Trends Panel (ATP), an online survey panel that is recruited through national, random sampling of residential addresses. This way nearly all U.S. adults have a chance of selection. The survey is weighted to be representative of the U.S. adult population by gender, race, ethnicity, partisan affiliation, education and other categories. Read more about the ATP’s methodology.
Here is the question used for this report, along with responses, and its methodology.
To examine changes in the White population in the U.S., we used Pew Research Center tabulations of PL94-171 census data for 2000-2020, Census Bureau tabulations for 1990 and IPUMS 5% census data for 1980. Data for detailed race groups from the 2020 and 2010 censuses can be found here.
Differences by age are especially pronounced. Among those ages 18 to 29, around three-in-ten (29%) say the fact that White people are declining as a share of the U.S. population is good for society, compared with 13% who say it is bad. By contrast, 32% of Americans ages 65 and older say this demographic shift is bad for society and only 6% say it is good.
Views also differ sharply by partisanship and ideology, even as nearly identical majorities of Republicans and Democrats (61% vs. 62%) say it is neither good nor bad for society that White people are declining as a share of the population.
About a third of Republicans and GOP-leaning independents (34%) say the decline of the White share of the population is bad for society, including 38% of conservative Republicans and 26% of moderate and liberal Republicans. Few Republicans (5%) say it is good for society.
By contrast, around a quarter of Democrats and Democratic leaners (24%) say this demographic shift is a good thing. However, liberal Democrats are more likely than conservative and moderate Democrats (32% vs. 17%) to say the declining share of White people is good for society, while conservative and moderate Democrats are more likely than their liberal counterparts (18% vs. 7%) to say this shift is bad.
Across racial and ethnic groups, majorities of Americans say it is neither good nor bad that White people are a declining share of the U.S. population, though White adults (26%) are somewhat more likely than Black (21%), Hispanic and Asian adults (16% each) to say the change is bad for society.
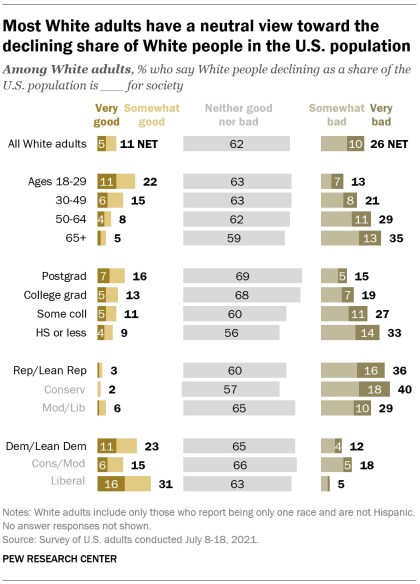
Among White adults, views differ little from the pattern in the overall public. About six-in-ten White adults of all ages say the declining share of White people in the population is neither good nor bad for society. But about a third of White adults 65 and older (35%) say it is bad for society, while just 13% of those under 30 say the same. And consistent with the overall partisan differences in these views, White Democrats (23%) are far more likely than White Republicans (3%) to say the declining share of White people in the U.S. population is good for society. Conversely, White Republicans are three times as likely as White Democrats (36% vs. 12%) to say this change is bad.
How the U.S. White population has changed over the decades
For the first time, the 2020 census showed the U.S. had a shrinking non-Hispanic White population that identifies with a single race, down 3% – or about 5.1 million people – from 2010 to 2020. The decline was widespread geographically, with 35 states seeing drops in their non-Hispanic White populations.
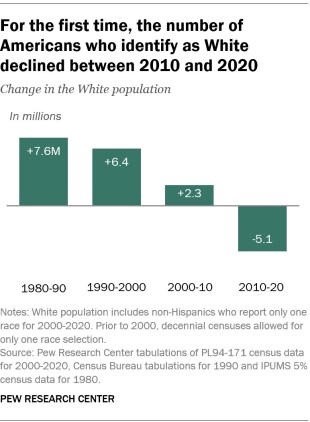
In previous decades, White people had still increased in numbers, but at a slower pace than other racial and ethnic groups, in particular Hispanic and Asian populations. (Unless otherwise specified, all racial groups in this analysis refer to non-Hispanics who identify with a single race.)
Despite its decline since 2010, the non-Hispanic White population of the U.S. stood at nearly 192.0 million in 2020 and remained the nation’s single-largest racial or ethnic group.
In 32 states, the overall population increased from 2010 to 2020, even as the non-Hispanic White population decreased. In these states, the largest decreases in the non-Hispanic White population came in Connecticut (-10%), while California, Maryland and New Jersey saw the next biggest decreases (-8% each). West Virginia, Illinois and Mississippi were the only states to see their total population decrease along with its non-Hispanic White population.
Only 15 states and the District of Columbia saw increases in their non-Hispanic White populations from 2010 to 2020, with the largest coming in D.C. (+25%), Utah (+11%) and Idaho (+10%).
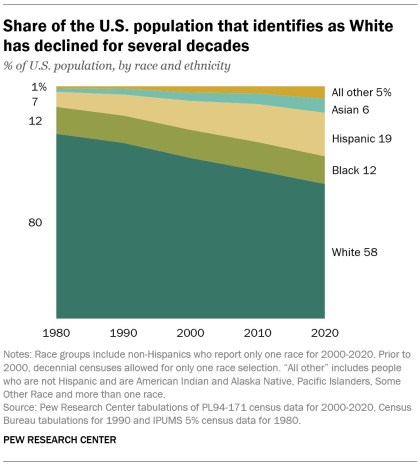
The share of people in the U.S. who identify as non-Hispanic White and no other race has also declined in recent years, falling from 64% in 2010 to 58% in 2020, according to the new census data. This trend stretches back several decades: Non-Hispanic White people declined as a share of the U.S. population from 1980 to 1990 (80% to 76%) and in every decade since then.
The non-Hispanic White share of the U.S. population remains far higher than the shares who identify as Hispanic (19%), Black (12%) or Asian (6%). Another 4% identify with two or more races and are not Hispanic. This pattern is due to several factors. The White population is older than other groups and aging faster, contributing to a lower birth rate and an increased number of deaths. In addition, immigration is not a source of significant growth for the White population. Immigrants account for a significantly smaller share of the White population than of other groups, in particular Asians and Hispanics.
The non-Hispanic White population in the U.S. that identifies with a single race is expected to fall below 50% by 2045, according to Census Bureau projections. However, this date is speculative, due in part to the nation’s growing multiracial population, changing demographic trends and uncertainty over how people’s views of their own identity may shift over time.
Racial identification in the 2020 census
Some people who identify their race as White also identify with another race or as Hispanic – or both as Hispanic and with another race. This more broadly defined White population saw modest growth of 2% from 2010 to 2020, increasing from 231.0 million to 235.4 million. However, the group’s share of the U.S. population declined over the past decade, from 75% to 71%.
The population growth of this racial group, referred to in census data as “White alone or in combination,” is due entirely to an increase in the number of people who identified as White and another race. From 2010 to 2020, their numbers grew from 5.0 to 12.2 million for non-Hispanics, and 2.5 million to 18.9 million for Hispanics.
These trends reflect broader societal changes in the U.S., such as the rising share of newlyweds who marry someone of another race and the growing number of multiracial or multiethnic babies. Americans’ views of their racial and ethnic identities also change over time, which can result in changes in how they report their race on census forms. Another contributing factor is that the format of the race questions in the 2020 census, as well as the way responses were coded, differed from previous versions of the decennial census.
Note: Here is the question used for this report, along with responses, and its methodology.