Now that Democrat Raphael Warnock of Georgia has won the final U.S. Senate race of this year’s midterm cycle, it’s clear that Senate elections continue to be very much in sync with states’ presidential votes.
Warnock’s victory means that only one of this year’s 35 Senate elections didn’t go the same way as the state’s 2020 presidential vote. The exception was Wisconsin, where Republican Sen. Ron Johnson won a third term this year by fewer than 27,000 votes – or 1% of the nearly 2.65 million votes cast – even though Democrat Joe Biden carried the state (by fewer than 21,000 votes) in 2020. Although Wisconsin’s Senate race was the lone exception this year, the midterms did reinforce the Badger State’s especially “swingy” reputation: Simultaneously with Johnson’s victory, Democratic Gov. Tony Evers won a second term by about 90,000 votes, or roughly 3.4 percentage points.
This is the second update to an analysis first published in June 2018 of the growing alignment between states’ presidential and senatorial votes. We relied on the Federal Election Commission, supplemented by information from the U.S. House Clerk’s office, for past years’ election results and compared the winning party in each Senate election with the outcome of the most recent presidential election in that state. The 2022 results were taken from The New York Times’ election tracker and The Washington Post.
For analytical purposes, special Senate elections were grouped with the closest midterm election. Three senators elected as independents who caucus, or caucused, with Senate Democrats (Bernie Sanders of Vermont, Angus King of Maine and Joseph Lieberman of Connecticut) were counted as Democrats.
The pattern of Senate votes tracking with presidential preference has its roots in the late 1980s, but it has become particularly pronounced over the past decade or so. The vast majority of Senate elections held since 2012 – 192 of 211, counting both regular and special elections – have been won by candidates who belonged to or were aligned with the party that won that state’s most recent presidential race, according to a Pew Research Center analysis of results going back to 1980. That represents a marked contrast with prior years: As recently as 2006, nearly a third of Senate contests (10 out of 33) were won by candidates of different parties than their state’s most recent presidential pick.
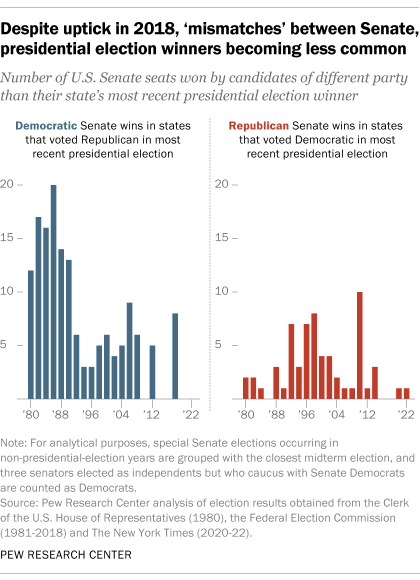
The 2017-18 election cycle departed a bit from the more recent pattern, but even then, there were only eight “mismatches” out of 36 regular and special Senate elections – all of them Democratic victories in states carried by Republican Donald Trump in the 2016 presidential race. (The election data used in this analysis comes mostly from the Federal Election Commission, supplemented by information from the U.S. House Clerk’s office. The 2022 results were taken from The New York Times’ election tracker.)
In earlier decades, mismatches between presidential and senatorial elections were more common. In 1980, for instance, Democrats won 12 of the 31 states that held Senate races that year and were carried by Republican Ronald Reagan. (Reagan won all but six states that year, and two of those six states elected Republican senators despite going for Democrat Jimmy Carter, the incumbent president.) In the 1982 midterms, Democrats won 17 of the 28 Senate contests held in states Reagan had won two years earlier.
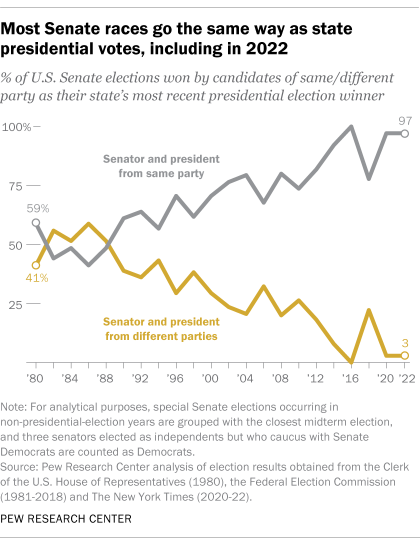
The “mismatch rate” – the percentage of Senate races won by an opposite-party candidate to a state’s most recent presidential vote – peaked at nearly 59% in 1986. That year, Democrats won back control of the Senate two years after Reagan’s 1984 landslide reelection, in which he won every jurisdiction except Minnesota and the District of Columbia. Of the 34 Senate races that year, Democrats won in 20 states Reagan had won two years earlier.
Since the late 1980s, however, the mismatch rate has generally trended lower. In 2012, the same year Democrat Barack Obama carried 26 states in his reelection bid, the mismatch rate was about 18%. Of the 38 regular and special Senate elections held in the 2013-14 cycle, all but three mirrored the 2012 presidential vote, for a mismatch rate of just under 8%. (The three exceptions all were Republicans elected to Senate seats in states Obama won.) In 2016, all 34 Senate contests tracked the presidential vote in their respective states.
One consequence of the increasing alignment between states’ presidential and Senate voting patterns is a decrease in split Senate delegations. In the incoming 118th Congress, just five states will be represented by senators of different parties, the lowest number of split delegations in at least 55 years.
The trend also is similar to the decline of split-ticket voting in House races – that is, voting for a House Democrat and a GOP presidential candidate, or vice versa. That development has contributed to the scarcity of House seats “flipping” from one party to the other: Although redistricting this year makes head-to-head comparisons difficult, only about 16 House seats clearly flipped from one party to the other this year.
Both the decline in split Senate delegations and in split-ticket voting in House races have been driven by the deep antipathy between Democrats and Republicans, on personal characteristics as well as fundamental political values.
Note: This is an update to a post originally published June 26, 2018, and most recently updated on Jan. 8, 2021.
