Partisan divides in the United States are as wide as they’ve ever been in the modern political era. But what about the large share of Americans who identify as independents?
A recent Pew Research Center report took a detailed look at these Americans. Among other things, it illustrated that independents have lower levels of political participation and are demographically different from those who affiliate with a party – and that their views are often as divided as those of self-identified partisans.
Here are six facts about political independents:
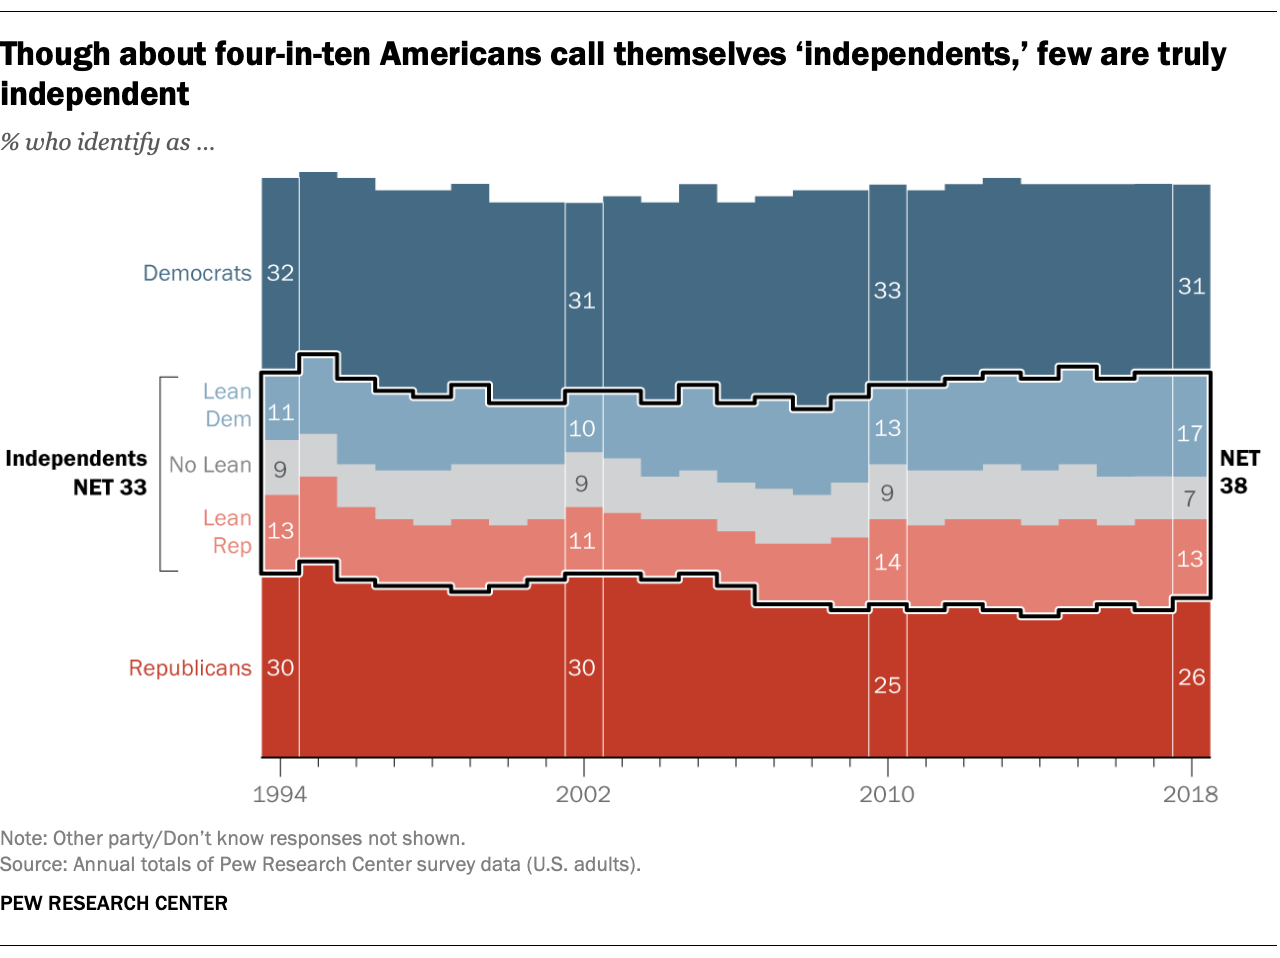
1Nearly four-in-ten U.S. adults (38%) identify as politically independent, but most “lean” toward one of the two major parties. Only 7% of Americans overall don’t express a partisan leaning, while 13% lean toward the Republican Party and 17% lean toward the Democratic Party.
2Independents who lean to one of the two parties are often much closer to partisans in their views than they are to independents who lean to the other party. For example, while 34% of independents as a whole said they approved of the way Donald Trump was handling his job as president in a March Pew Research Center survey, the gap between independents who lean to the GOP and those who lean to the Democratic Party (73% vs. 9%) was nearly as wide as the gap between Republicans and Democrats (85% vs. 8%).
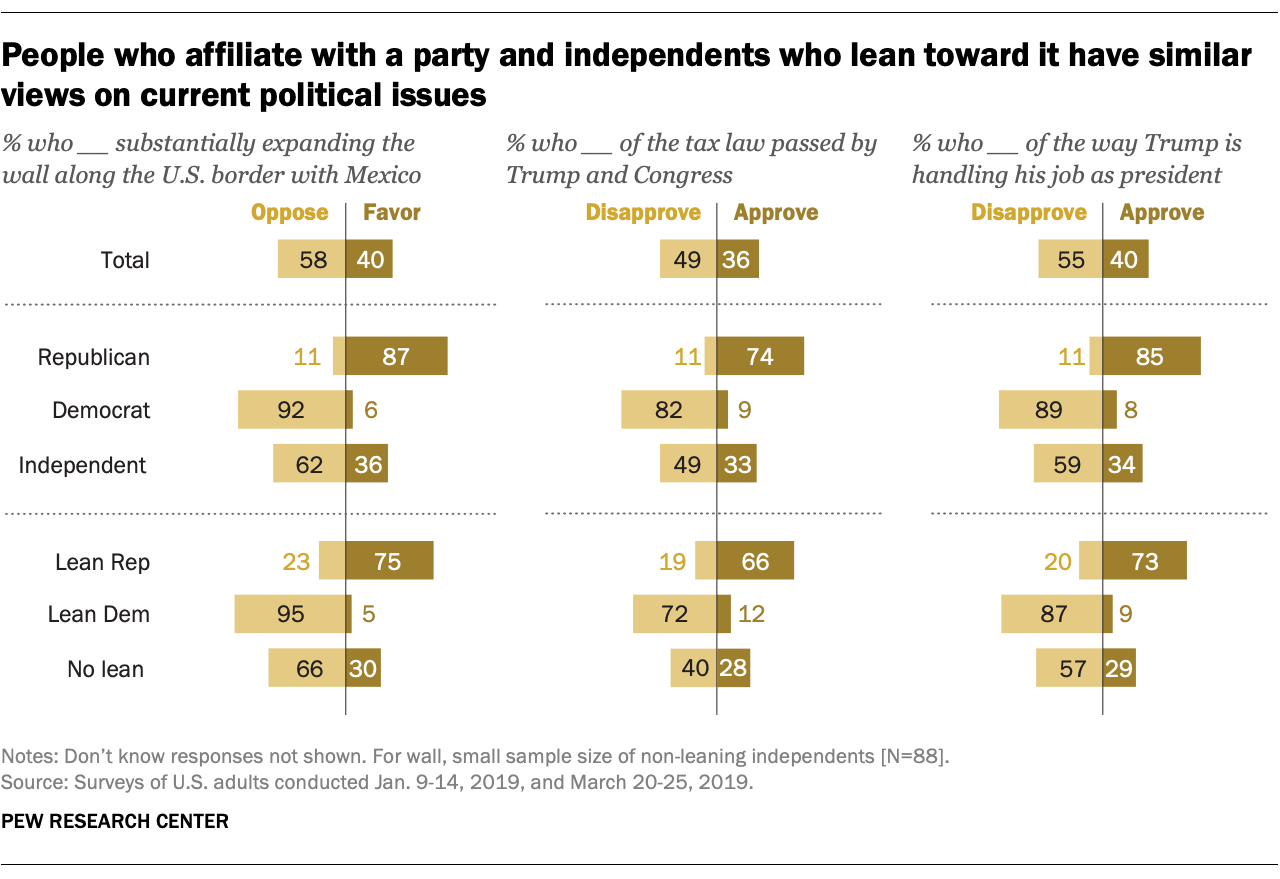 There are similar patterns in many political areas. While 36% of all independents favored substantially expanding the wall along the U.S.-Mexico border in a January survey, 75% of Republican-leaning independents – but just 5% of Democratic leaners – said this. For this reason, it can be misleading to look at “independents” as a single bloc.
3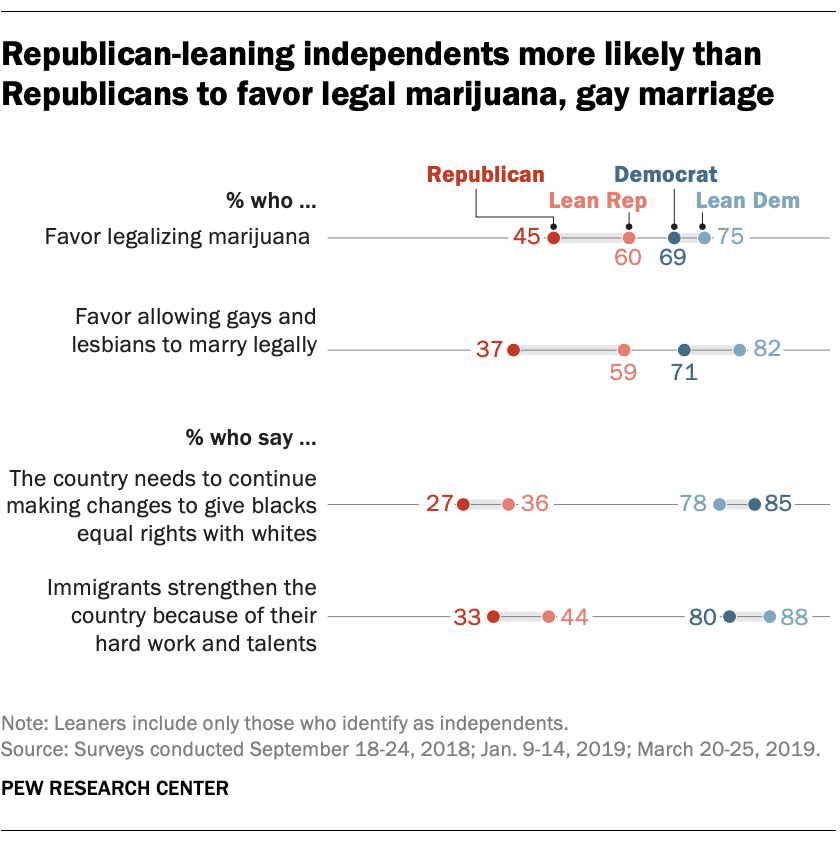 On some issues, there are significant differences between leaners and partisans. Nearly six-in-ten Republican-leaning independents (59%), for example, currently favor allowing gays and lesbians to marry legally, compared with 37% among Republican identifiers. And while clear majorities of both Democrats and Democratic leaners favor same-sex marriage, Democratic-leaning independents are somewhat more likely than Democrats to hold this view (82% vs. 71%).
In a survey last fall, clear majorities of Democrats (69%), Democratic-leaning independents (75%) and Republican-leaning independents (60%) favored marijuana legalization, but Republicans were divided (45% favored, 51% opposed).
While partisan divides over immigration extend to leaners as well, independents in both partisan groups are also more likely than partisan identifiers to express positive views about immigrants. Nearly nine-in-ten Democratic leaners say immigrants strengthen the country because of their hard work and talents, compared with a somewhat narrower majority of Democrats (80%). By comparison, 44% of Republican leaners and 33% of Republicans say the same.
Wide majorities of both Democrats and Democratic leaners say more needs to be done to give blacks equal rights with whites, while partisan identifiers are somewhat more likely than leaners to say this (85% vs. 78%). Within the GOP coalition, 36% of Republican leaners share this view, versus 27% of Republican identifiers.
4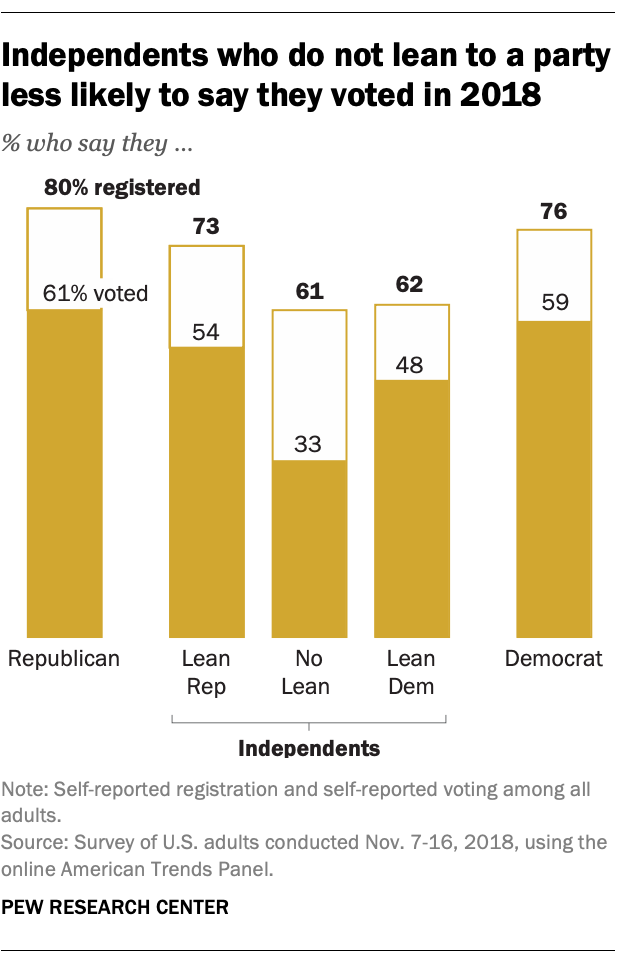 Independents – particularly the 7% of Americans who don’t lean toward a party – are less politically engaged than partisans. In a survey conducted shortly after the November 2018 midterm election, just a third of those who don’t lean toward either party (33%) reported voting. Democratic leaners (48%) and Republican leaners (54%) were considerably more likely to say they voted, though both groups reported lower rates of voting than partisans.
5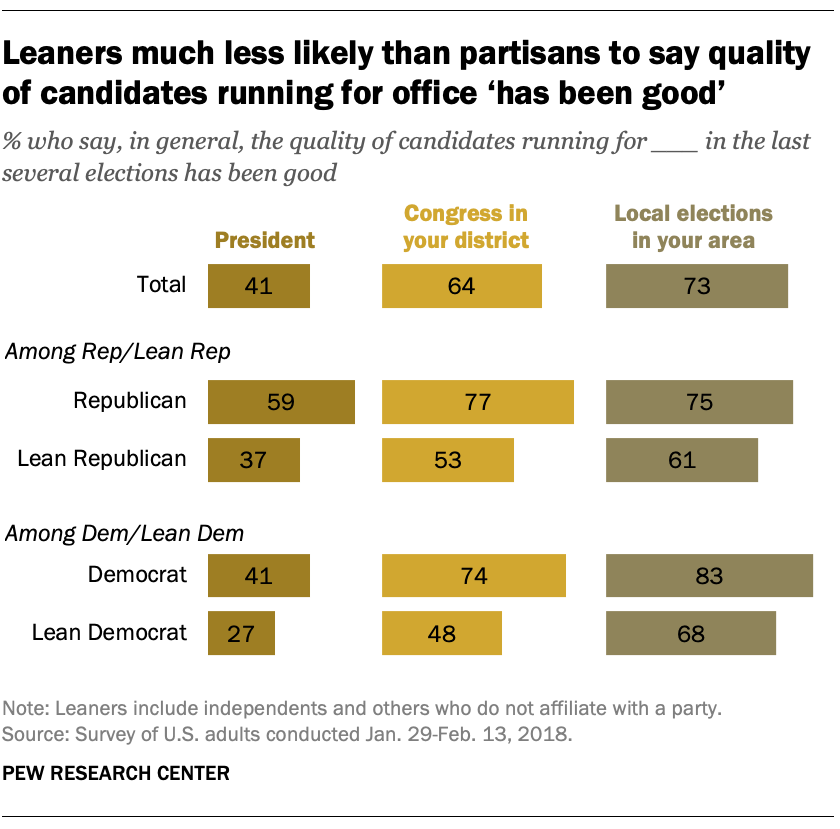 Independents feel more negatively about political candidates and parties than partisans. In early 2018, similar shares of Republicans (77%) and Democrats (74%) said the quality of candidates running for Congress in their district in the last several elections had been good. But those who leaned toward the parties were much less likely to say this.
This pattern holds for other offices as well: In views of candidates for president and local elections, independent leaners are consistently less likely than partisans to rate the quality of these candidates positively.
In addition, independents are more likely than partisans to have negative views of both major parties. About a quarter of both Republican leaners (24%) and Democratic leaners (27%) view both parties unfavorably, as do 37% of those with no partisan leaning. By comparison, only about one-in-ten partisans view both parties negatively.
6Independents are younger and more likely to be male than partisans. While 45% of Republicans and 51% of Democrats are under age 50, these shares rise to 55% among Republican-leaning independents and 68% among Democratic leaners. And while men account for about half of Republicans (51%) and four-in-ten Democrats (40%), they account for 64% of Republican leaners and 51% of Democratic leaners.
This is an update of a post originally published July 5, 2016, and written by Samantha Smith, a former research assistant at Pew Research Center.
