
Spring reliably brings a whirlwind of number-crunching and form-filing as Americans finish their tax returns. Altogether, the IRS expects to process more than 160 million individual and business tax returns this season.
Ahead of Tax Day on April 15, here are seven facts about Americans and federal taxes, drawn from Pew Research Center surveys and analyses of federal data.
Ahead of Tax Day 2024, Pew Research Center sought to understand Americans’ views of the federal tax system and outline some of its features.
The public opinion data in this analysis comes from Pew Research Center surveys. Links to these surveys, including details about their methodologies, are available in the text.
The external data comes from the U.S. Office of Management and Budget and the IRS Data Book. Data is reported by fiscal year, which for the federal government begins Oct. 1 and ends Sept. 30. For example, fiscal 2024 began Oct. 1, 2023, and ends Sept. 30, 2024.
A majority of Americans feel that corporations and wealthy people don’t pay their fair share in taxes, according to a Center survey from spring 2023. About six-in-ten U.S. adults say they’re bothered a lot by the feeling that some corporations (61%) and some wealthy people (60%) don’t pay their fair share.
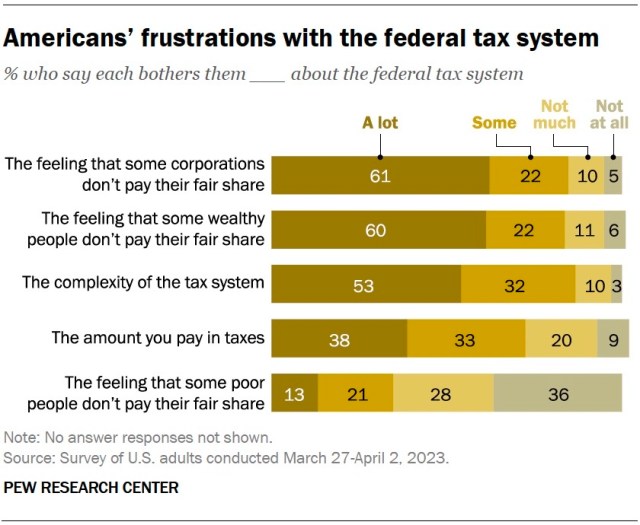
Democrats are far more likely than Republicans to feel this way. Among Democrats and Democratic-leaning independents, about three-quarters say they’re bothered a lot by the feeling that some corporations (77%) and some wealthy people (77%) don’t pay their fair share. Much smaller shares of Republicans and GOP leaners share these views (46% say this about corporations and 43% about the wealthy).
Meanwhile, about two-thirds of Americans (65%) support raising tax rates on large businesses and corporations, and a similar share (61%) support raising tax rates on households with annual incomes over $400,000. Democrats are much more likely than Republicans to say these tax rates should increase.
Just over half of U.S. adults feel they personally pay more than what is fair, considering what they get in return from the federal government, according to the same survey.
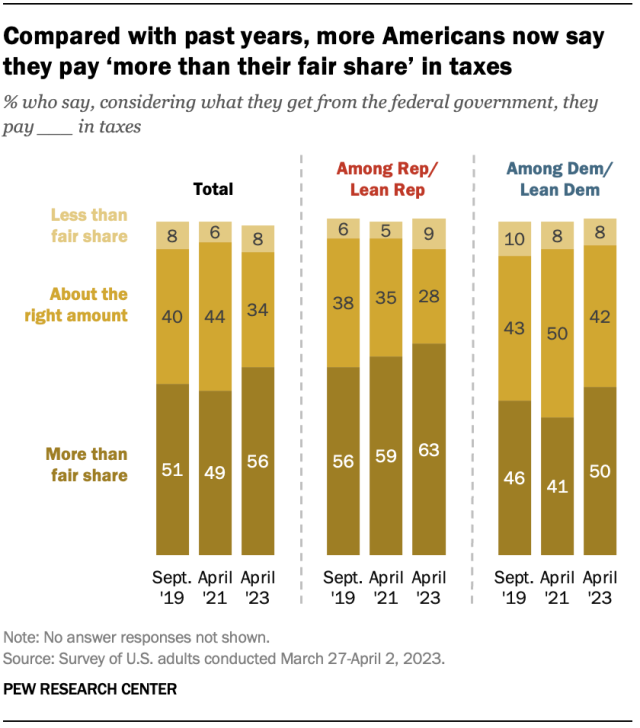
This sentiment has grown more widespread in recent years: 56% of Americans now say they pay more than their fair share in taxes, up from 49% in 2021. Roughly a third (34%) say they pay about the right amount, and 8% say they pay less than their fair share.
Republicans are more likely than Democrats to say they pay more than their fair share (63% vs. 50%), though the share of Democrats who feel this way has risen since 2021. (The share among Republicans is statistically unchanged from 2021.)
Many Americans are frustrated by the complexity of the federal tax system, according to the same survey. About half (53%) say its complexity bothers them a lot. Of the aspects of the federal tax system that we asked about, this was the top frustration among Republicans – 59% say it bothers them a lot, compared with 49% of Democrats.
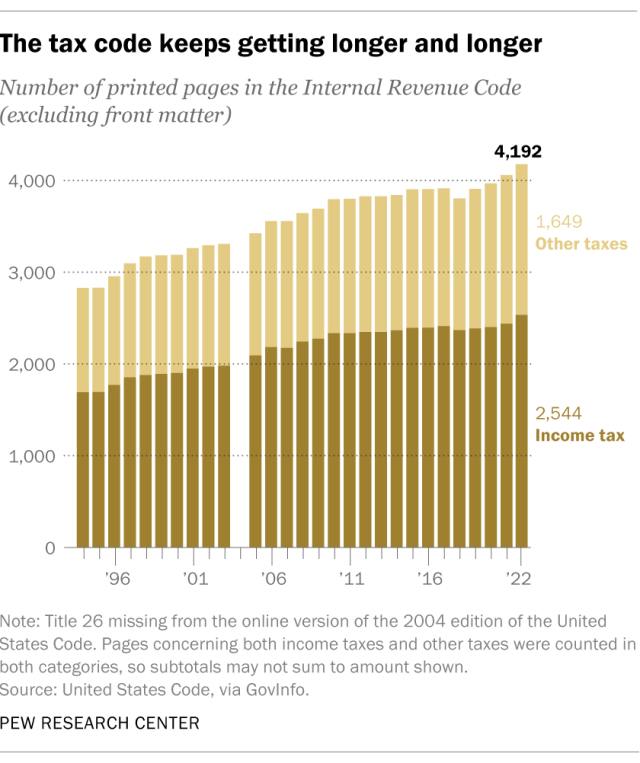
Undeniably, the federal tax code is a massive document, and it has only gotten longer over time. The printed 2022 edition of the Internal Revenue Code clocks in at 4,192 pages, excluding front matter. Income tax law alone accounts for over half of those pages (2,544).
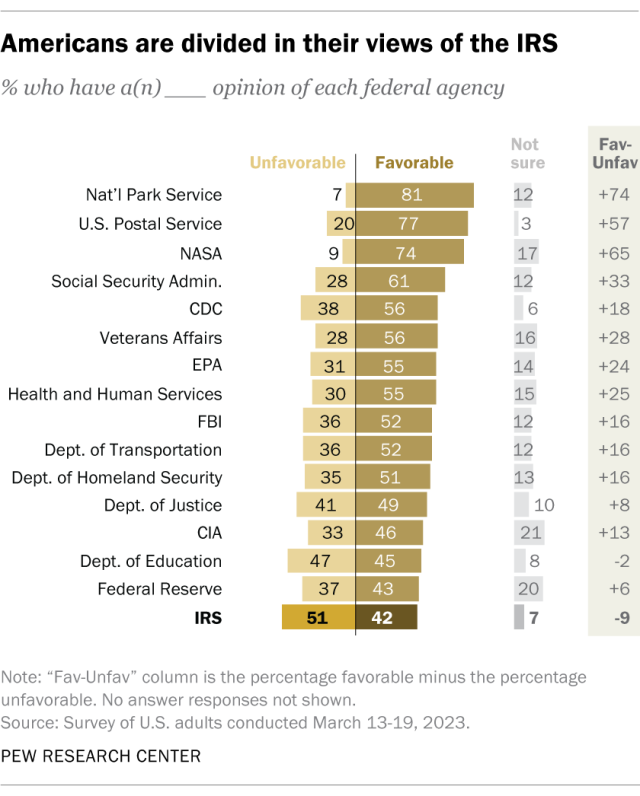
The public is divided in its views of the IRS. In a separate spring 2023 Center survey, 51% of Americans said they have an unfavorable opinion of the government tax agency, while 42% had a favorable view of the IRS. Still, of the 16 federal agencies and departments we asked about, the IRS was among the least popular on the list.
Views of the IRS differ greatly by party:
- Among Republicans, 29% have a favorable view and 64% have an unfavorable view.
- Among Democrats, it’s 53% favorable and 40% unfavorable.
On balance, Democrats offer much more positive opinions than Republicans when it comes to most of the federal agencies we asked about. Even so, the IRS ranks near the bottom of their list.
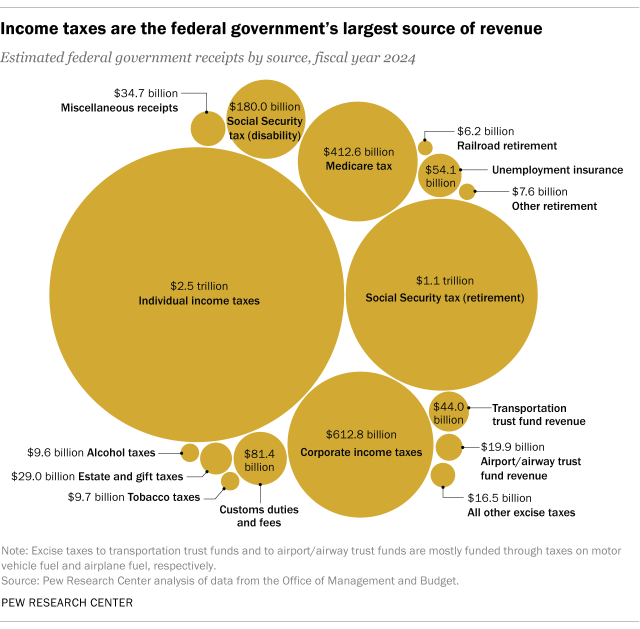
Individual income taxes are by far the government’s largest single source of revenue, according to estimates from the Office of Management and Budget (OMB).
The federal government expects to collect about $2.5 trillion in individual income taxes in fiscal year 2024. That accounts for nearly half (49%) of its total estimated receipts for the year. The next largest chunk comes from Social Security taxes (including those for disability and retirement programs), which are projected to pull in $1.2 trillion this fiscal year (24%).
By comparison, corporate income taxes are estimated to bring in $612.8 billion, or 12% of this fiscal year’s federal receipts. And excise taxes – which include things like transportation trust fund revenue and taxes on alcohol, tobacco and crude oil – are expected to come to $99.7 billion, or 2% of receipts.
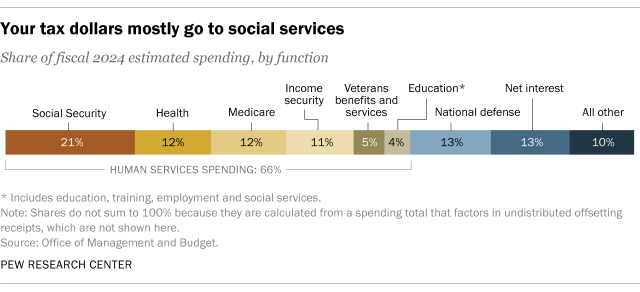
American tax dollars mostly go to social services. Human services – including education, health, Social Security, Medicare, income security and veterans benefits – together will account for 66% ($4.6 trillion) of federal government spending in fiscal 2024, according to OMB estimates.
An estimated 13% ($907.7 billion) will go toward defense spending. Another 13% ($888.6 billion) will repay net interest on government debt, and 10% ($726.9 billion) will fund all other functions, including energy, transportation, agriculture and more.
Related: 6 facts about Americans’ views of government spending and the deficit
The vast majority of Americans e-file their taxes, according to IRS data. In fiscal 2022, 150.6 million individual federal income tax returns were filed electronically, accounting for 94% of all individual filings that year.
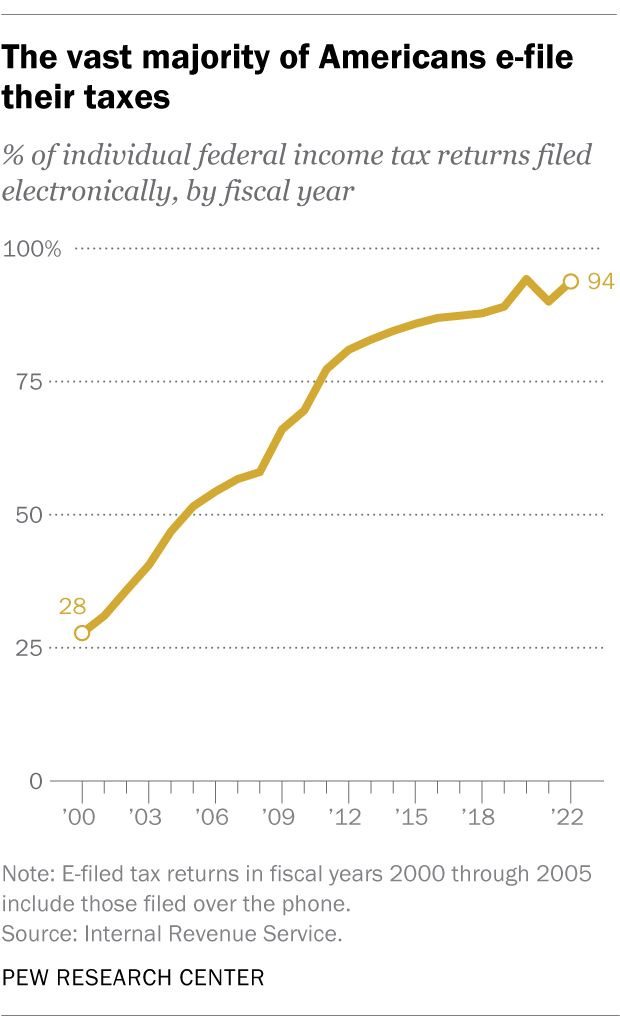
Unsurprisingly, e-filing has become more popular since the turn of the century. Fiscal 2000, the earliest year for which comparable data is available, saw 35.4 million individual income tax returns filed electronically (including those filed over the phone). These accounted for just 28% of individual filings that year.
By fiscal 2005, more than half of individual income tax returns (52%) were filed electronically.
Note: This is an update combining information from two posts originally published in 2014 and 2015.
