With the stock market hitting new highs and home prices marking their strongest gains since before the bubble burst, it’s starting to feel like a real economic recovery. But which is the better investment over time? That depends largely on your definition of “long term.”
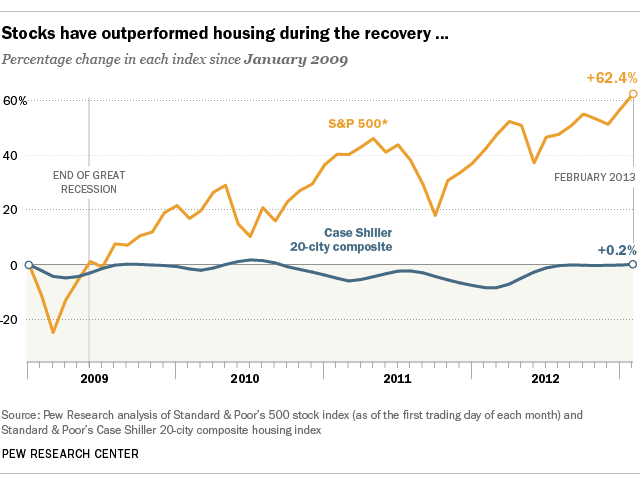
As the accompanying charts show, since the formal end of the recession, the stock market (as measured by the benchmark Standard & Poor’s 500 index) has recovered much more strongly than housing. As of Tuesday’s market close, the S&P 500 was up more than 74% (excluding dividends) since the beginning of 2009; although home values, as measured by the S&P/Case-Shiller index, were up 9.3% between February 2012 and February 2013 (the most recent data available), the index stands almost exactly where it did four years ago. (See this post for more discussion of the Case-Shiller index and how it’s calculated.)
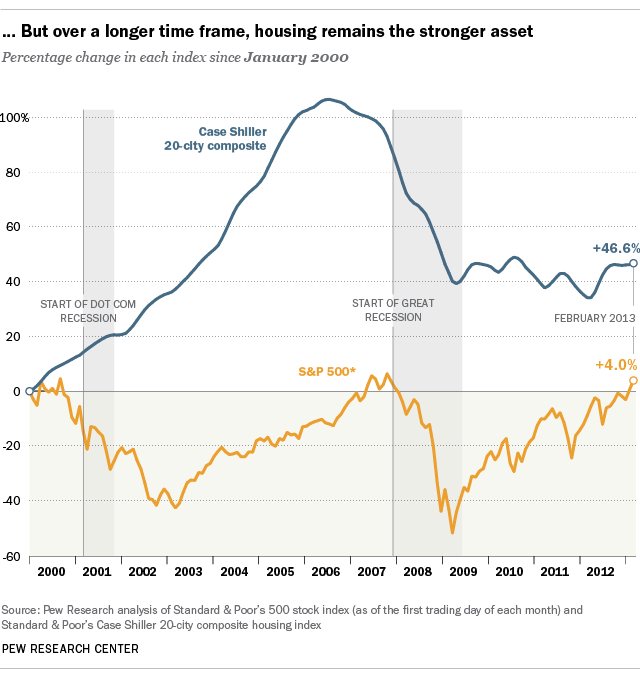
Go back further — say, to the beginning of 2000 — and a different picture emerges. Stocks at the time were riding the crest of the dot-com wave, but when that wave crashed stock prices fell sharply and took years to recover. Housing, though, barely paused in its long upward march, peaking in 2006-07 (depending on the individual market) before plunging. Still, the Case-Shiller index stood 46.6% higher in February than it did in January 2000, while the S&P 500 was up just 4% over that same period (though subsequent gains to date have pushed the overall increase to 11.2%).
But unlike houses, many stocks pay dividends (especially in the large-capitalization S&P 500), which changes the return calculus yet again. Using a “total return” variant of the S&P 500 that takes dividends into account, the index is up nearly 43% since January 2000 — almost matching the gain in the Case-Shiller.
In short, much depends not just on which asset you buy but when you buy it. People who bought stocks in late 2008 or early 2009 have done very well; people who bought a year earlier, near the market’s peak, and held on have just recently broken even. And in all 20 metro areas that comprise the Case-Shiller index, home prices are still below their local peaks (which ranged between mid-2005 and mid-2007).
The differing performance histories for stocks and housing have real consequences. According to a recent Pew Research report, affluent households — defined as those with net worth of at least $500,000 — are far more likely to own stocks and other financial assets than less-affluent households. According to the survey, 62% of affluent households reported owning stocks and mutual-fund shares, versus 16 percent of the households below-$500,000. Nearly as many (61%) said they owned 401(k)-type retirement accounts, compared with 39% of the less-affluent households.
Due largely to that concentration of stock ownership, the affluent (who comprise about 7% of the nation’s households) have benefited more from the ongoing recovery than the lower 93%, much more of whose net worth is tied up in home equity.
It’s worth noting that a Gallup survey conducted in April and published today found that 52% of Americans say they own stocks directly or indirectly – the lowest level since they began asking the question in 1998, and down from 65% as recently as 2007. The ownership rate fell among all income groups, but the group that lost the most was the middle. Those with income between $30,000 to $74,999 declined 16% in 2013 compared to those surveyed in 2008.
Americans are an optimistic lot, especially when it comes to their homes. Just over two years ago, when the housing bubble’s collapse was fresher in people’s minds, eight out of 10 people surveyed for a Pew Research report agreed that buying a home was the best long-term investment a person can make.
But not everyone agrees. Robert Shiller, the Yale economics professor who co-developed the Case-Shiller index, said recently that most people would be better off putting their money into stocks than housing.