A 2019 Pew Research Center study and follow-up study in 2020 involved the complicated task of transcribing more than 60,000 audio and video files of sermons delivered during religious services at churches around the United States. The primary goal of this research was to evaluate relatively broad topics discussed in the sermons to determine if there were any notable patterns or denominational differences in their length and subject matter.
The huge number of audio and video files meant that it would have been too time-consuming and expensive to ask humans to transcribe all the sermons. Instead, we used Amazon Transcribe, a speech recognition service offered by Amazon Web Services (AWS). We hoped to identify the key themes in the sermons we collected, even if the machine transcriptions were not perfect or at times lacked elements like punctuation that would often come with a traditional human transcription service.
Overall, the machine transcriptions were legible. But we did run into a few challenges. The Amazon service did not always get specific religious terminology or names right. (A few examples included “punches pilot” instead of “Pontius Pilate” and “do Toronto me” in lieu of “Deuteronomy.”) There were also some recordings for which the machine transcription was simply of low quality across the board.
A notable body of research has found that machine transcription sometimes struggles with certain accents or dialects, like regional Southern accents and African American English (AAE). This led us to wonder if the errors we were seeing in the machine transcripts of sermons was coincidental, or if we were encountering performance biases that could be making some transcriptions more reliable than others in a way that might affect the conclusions of our research.
Since we downloaded our sermon files directly as audio or audio/video, we lacked an original written transcript to compare against the machine-transcribed text. Instead, as a test, we asked a third-party human transcription service to tackle portions of some of the sermons that Amazon Transcribe had already transcribed and then compared the results between the two.
What we did
For this experiment, we were interested in using sermons that included a variety of regional accents and dialects among the speakers. One obvious challenge, however, was that we didn’t know much about the speakers themselves. We knew the location of the church where the sermon was delivered, as well as its religious tradition, but these were not necessarily sufficient to assign an accent or a dialect to the person speaking in a recording. We could only use these features as approximations.
With that caveat in mind, we focused the analysis on audio files from the four main religious traditions for which we had a reportable sample size: mainline Protestant, evangelical Protestant, historically Black Protestant and Catholic. We also examined three large geographic regions: the Midwest, the South and a combined region that merges the Northeast and the West (again to account small sample sizes in those two regions).
We took a stratified random sample of 200 sermons from churches for each combination of religious tradition and region, proportional to the number of sermons each church had in the dataset. From this sample of full audio files, we took one random snippet of audio with a duration of 30 to 210 seconds from each file and sent those audio snippets to our external human transcription service. This service was a standard online provider that claimed to have native language speakers, a multistep quality check process and experience transcribing religious content, including sermons specifically. At the end of this process, we had a total sample size of 2,387 texts with both machine and human transcriptions.
How we compared transcriptions
There are a variety of computational methods to measure the similarity or difference between two sets of text. In this analysis, we used a metric known as Levenshtein distance to compare our machine and human transcriptions.
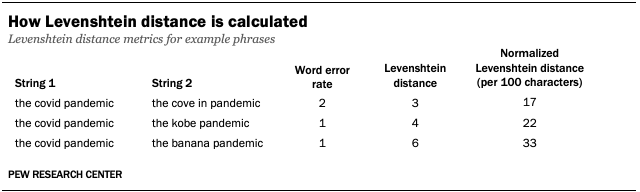
Levenshtein distance counts the number of discrete edits – insertions, deletions and substitutions – at the character level necessary to transform one text string into another. For example, if the word “COVID” is transcribed as “cove in,” there is a Levenshtein distance of three, as the transformation requires three edits: one edit to add a space between the “v” and the “i,” one edit to add an “e” after the “v,” and one edit to substitute the “d” for an “n.”
Levenshtein distance is useful as a comparison metric because it can be normalized and used to compare texts of different lengths. It also allows for nuance by focusing on character-level edits rather than entire words, providing more granularity than something like simple word error rate by scoring how incorrect a mistranscription is.
As a final bit of housekeeping, we standardized both our machine and human transcriptions to make sure that they matched one another stylistically. We transformed all the text into lower case, spelled out numbers and symbols when appropriate, and removed punctuation, filler words and words associated with vocalizations (such as “uh” or “ooh”). We also removed the “[UNINTELLIGIBLE]” annotations that the human transcription service included at our request to flag cases in which someone was speaking but their words couldn’t be clearly understood.
Results
Across all the audio files we evaluated, the average difference between machine transcriptions and human transcriptions was around 11 characters per 100. That is, for every 100 characters in a transcription text, approximately 11 differed from one transcription method to the other.
We were also interested in looking at the difference across religious traditions and geographical regions. To do so, we used pairwise t-tests to test for differences in means across all religious traditions and all regions. (We did not calculate comparisons between each religious tradition and region combination after determining the interaction of the two variables was not statistically significant.)
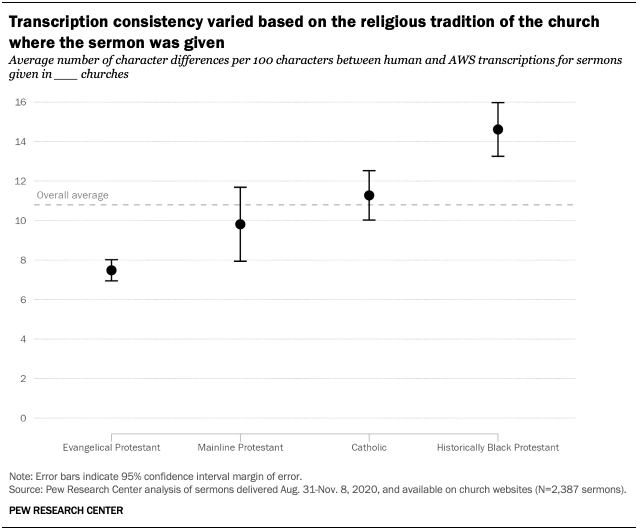
The analysis found a small but statistically significant difference in Levenshtein distances between machine and human transcriptions for several religious traditions. Text taken from Catholic sermons, for example, had more inconsistency between transcripts than was true of those taken from evangelical Protestant sermons. And sermons from historically Black Protestant churches had significantly more inconsistency in transcriptions when compared with the other religious traditions.
While these differences were statistically significant, their magnitude was relatively small. Even for historically Black Protestant sermons – the tradition with the largest mismatch between machines and humans – the differences worked out to around just 15 characters per 100, or four more than the overall average. It’s also important to remember that we cannot assume the speaker is speaking AAE simply because the sermon was given in a historically Black Protestant church.
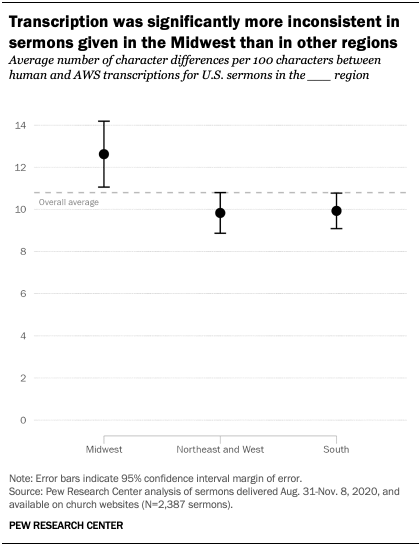
One expectation we had going into this experiment is that machine transcription would perform worst with Southern accents. However, we found that transcriptions of sermons from churches in the Midwest had significantly more inconsistency between machine and human transcriptions than those in other regions. Anecdotally, it appears this discrepancy may be because human transcribers had more difficulty than machines in understanding speakers in the Midwest: Sermon texts from the Midwest that were transcribed by humans included a greater number of “[UNINTELLIGIBLE]” annotations than those from other regions. There may also be other factors affecting transcription quality that we cannot account for, such as the possibility that sermons from the Midwest had systematically worse audio quality than those from other regions.
Again, although these differences were statistically significant, their magnitude was relatively small. Midwestern sermons, despite having the greatest inconsistency across regions, had only two more character differences per 100 characters than the overall average.
Conclusions and suggestions
In social science research, automated transcription services have become a popular alternative to human transcription because of the costs and labor involved in the latter. All in all, we found that the machine transcriptions and the human transcriptions used in this experiment were comparable enough to justify our decision to use an automated service in our research on U.S. sermons.
However, our experience does suggest a few ideas that researchers should keep in mind should they find themselves in a similar situation.
First, issues with transcription quality can be tied to the quality of the audio being transcribed – which presents challenges for humans and computers alike. By the same token, machine transcription may perform worse or better on certain accents or dialects – but that’s also true for human transcribers. When working with audio that has specialized vocabulary (in our case, religious terms), human transcribers sometimes made errors where machines did not. This is likely because a robust machine transcription service will have a larger dictionary of familiar terms than the average person. Similarly, we found that humans are more likely to make typos, something one will not run into with machine transcription.
More generally, reliability is usually an advantage of machine transcription. Human transcription can vary in quality based on the service used, and possibly from one transcript to another if there are multiple human transcribers. But the reliability of machine transcription can sometimes backfire. When presented with a segment of tricky audio, for example, humans can determine that the text is “unintelligible.” A machine, on the other hand, will try to match the sounds it hears as closely as possible to a word it knows with little to no regard for grammar or intelligibility. While this might produce a phonetically similar transcription, it may deviate far from what the speaker truly said.
Ultimately, both machine and human transcription services can be viable options. Beyond the obvious questions of budget and timeline that are often primary considerations, we would suggest evaluating the nature of the audio files that are being analyzed before transcription begins. Audio of mixed quality, or which features competing sound from an audience, can be tricky for humans and machines alike.
Researchers should also determine how important it is to have formatting and punctuation in the text they hope to analyze. Our researchers found that the lack of these elements can be a key barrier to understanding the meaning of a particular piece of text quickly. In our case, it wasn’t an insurmountable barrier, but it certainly added a significant cognitive burden to tasks like labeling training data. And it might have posed an even bigger problem had our analysis relied more heavily on unguided methods for identifying our topics of interest.


