

A major new Pew Research Center study examines religious beliefs and practices in India. In order to represent the views of Indians from a wide range of backgrounds, the Center conducted the largest single-country survey it has ever fielded outside of the United States.
The study took more than three years to complete. It included extensive background research, consultations with academic advisers, preliminary qualitative work and the development of a comprehensive questionnaire and sampling strategy. The project culminated with face-to-face interviews with 29,999 Indian adults conducted from November 2019 to March 2020.
In this Q&A, research methodologist Martha McRoy explains how the research team conducted this project and discusses some of the challenges they faced along the way. You can also watch the below video explainer of the process (and for a version that’s been translated into Hindi, see here).
Why was the sample size for this survey nearly 10 times larger than the sample for the Center’s other recent surveys of India?
The Center’s most recent surveys of India had much smaller sample sizes than this project. Our spring 2019 Global Attitudes Survey relied on interviews with 2,476 Indians, while our 2019–2020 International Science Survey included 3,175 respondents. A key difference is that these studies “only” required nationally representative samples, meaning that our data needed to represent the general population of the country.
What sets this study apart — and why we needed the larger sample size — was our aim of examining differences between geographic regions in India, as well as differences within and across major religious groups regarding their beliefs, practices and sociopolitical views. We didn’t just want to know what Indians thought, but also what members of each religious group in India thought.
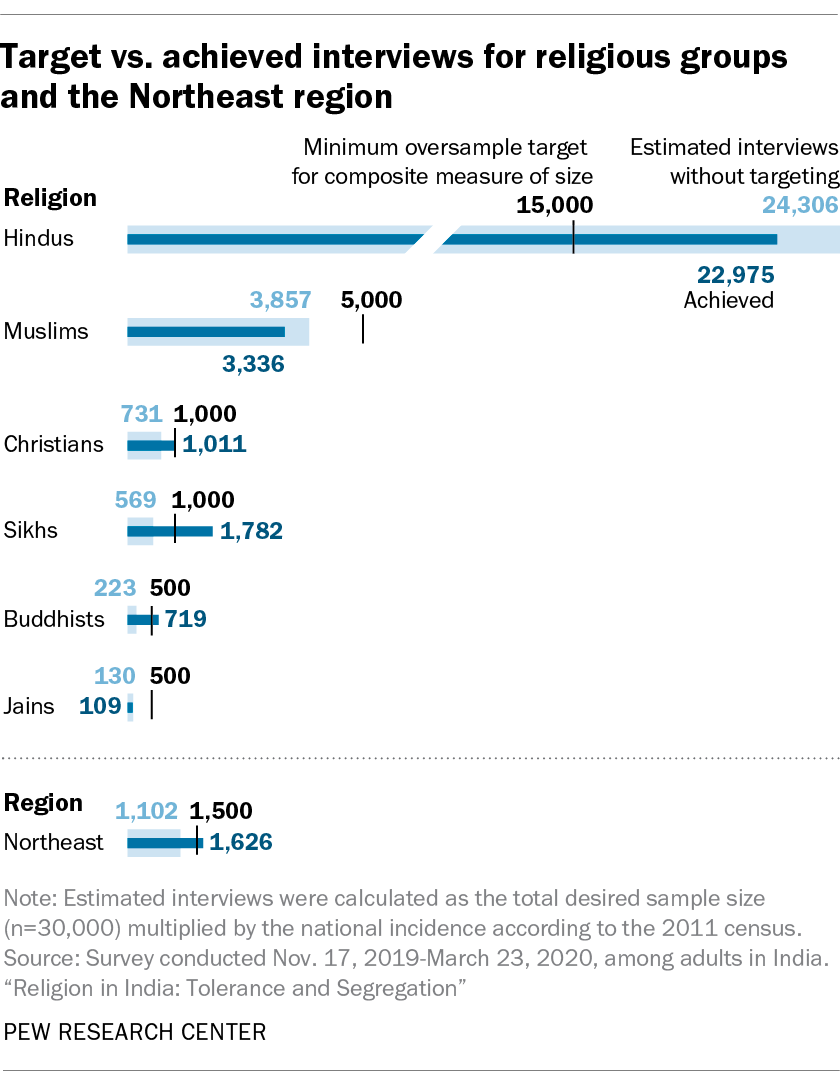
Our earlier surveys of India were large enough to examine demographic differences in public attitudes, such as by gender and age. But the larger sample size in the new study allowed us to look at these demographic breaks within many of the religious groups and regions of the country, too. The substantial sample also allowed for comparisons across the six major religious groups in India — Hindus, Muslims, Sikhs, Christians, Buddhists and Jains — even though some make up less than 1% of the nation’s population.
What else did you need to consider to study religious groups and geographic regions in India?
Not only did we need to increase our sample sizes, but we also needed to target where we would conduct interviews in order to have large enough samples from the six largest religions and the six geographical regions of the country: North, Central, East, West, South and the Northeast.
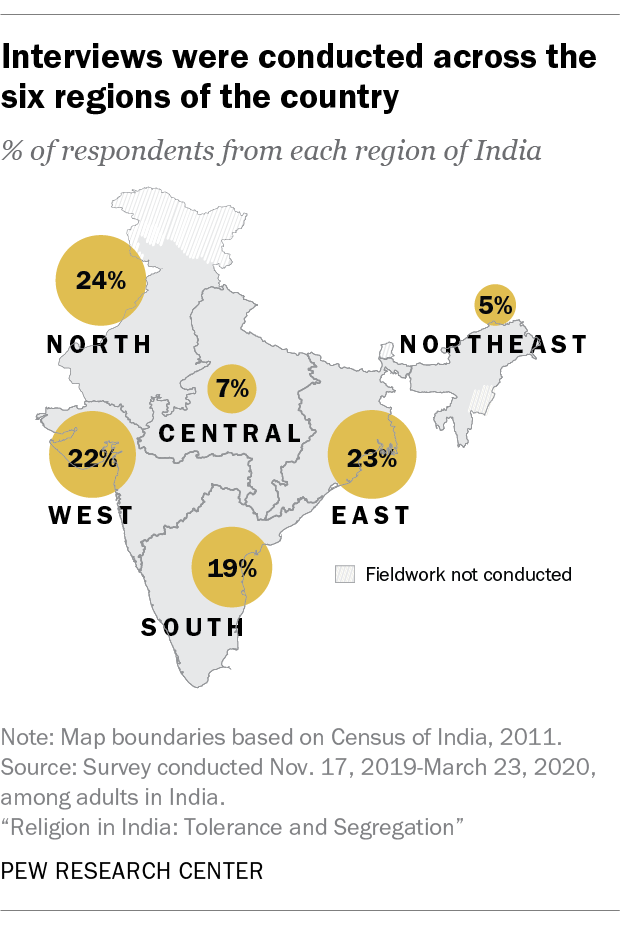
In some instances, it was easy to know where to go. For example, while Sikhs make up about 2% of the Indian population overall, we aimed for Sikhs to make up roughly 3% of our sample so we could do an in-depth analysis of the religion. Sikhism is the majority religion in the state of Punjab, so we were able to conduct more interviews with Sikhs by increasing the sample allocated to Punjab. Similarly, the Northeast region accounts for only 3% of the total population of India, but to make inferences about the residents of that region, we needed to allocate 5% of our study sample there. As with Sikhs in Punjab, we could easily select more sampling points in the Northeast region.
Gathering representative views of some of the other major religious groups in India involved a more complex approach, as these groups are not always clustered in a specific area and make up very small percentages of the country’s total population. For example, we aimed for approximately 2% of our total sample to be Buddhists — even though they only make up 0.7% of the total population — and another 2% of our sample to be Jains, who account for only 0.4% of the total population. We also wanted to keep a probability-based design, which means there is a known and calculatable chance of every adult in the country being selected for our study. This also allows us to test for statistical differences.
To keep a probability-based design, we did not recruit people to the survey based on their religious affiliation (quota sampling) or based on whether another survey participant recommended them (snowball sampling). These approaches could have biased our results since respondents would have been hand-selected and would not necessarily be representative of the entire country or all members of a particular religious group. Instead, we used a probability-based methodology called “composite measure of size” that increased our chances of selecting respondents from Muslim, Buddhist, Christian, Sikh or Jain backgrounds as compared to the natural distribution we’d expect from the general population.
To better explain this composite measure of size, let’s pretend we had two villages of 100 people each, and we were going to select one of them. Typically, each village would have an equal chance of selection: 50%. However, we know that the first village has 10 people of a minority population and the second has 20 people of this same group. Using this information, we modify the probabilities of selecting each village to represent the proportions of these minority populations instead. The first village’s chance is now 10 out of 30, or 33%, while the second village’s chance is 20 out of 30, or 67%. Now imagine adjusting these figures for six different religious groups instead of just one across an entire country!
As you’d expect, this methodology for sampling respondents of different attributes at higher rates than the actual distribution of the population means our sample no longer looks like the general population of the country. We correct for that through a process known as weighting, where we first take into account the probabilities of each respondent being included in our survey; then account for those unwilling to participate; and then adjust these figures to the known data of the 2011 Indian census (the most recent one). This entire process ensures that we have enough respondents from each group we wish to study while also making sure the sample represents all of India.
How did you sample respondents for this study?
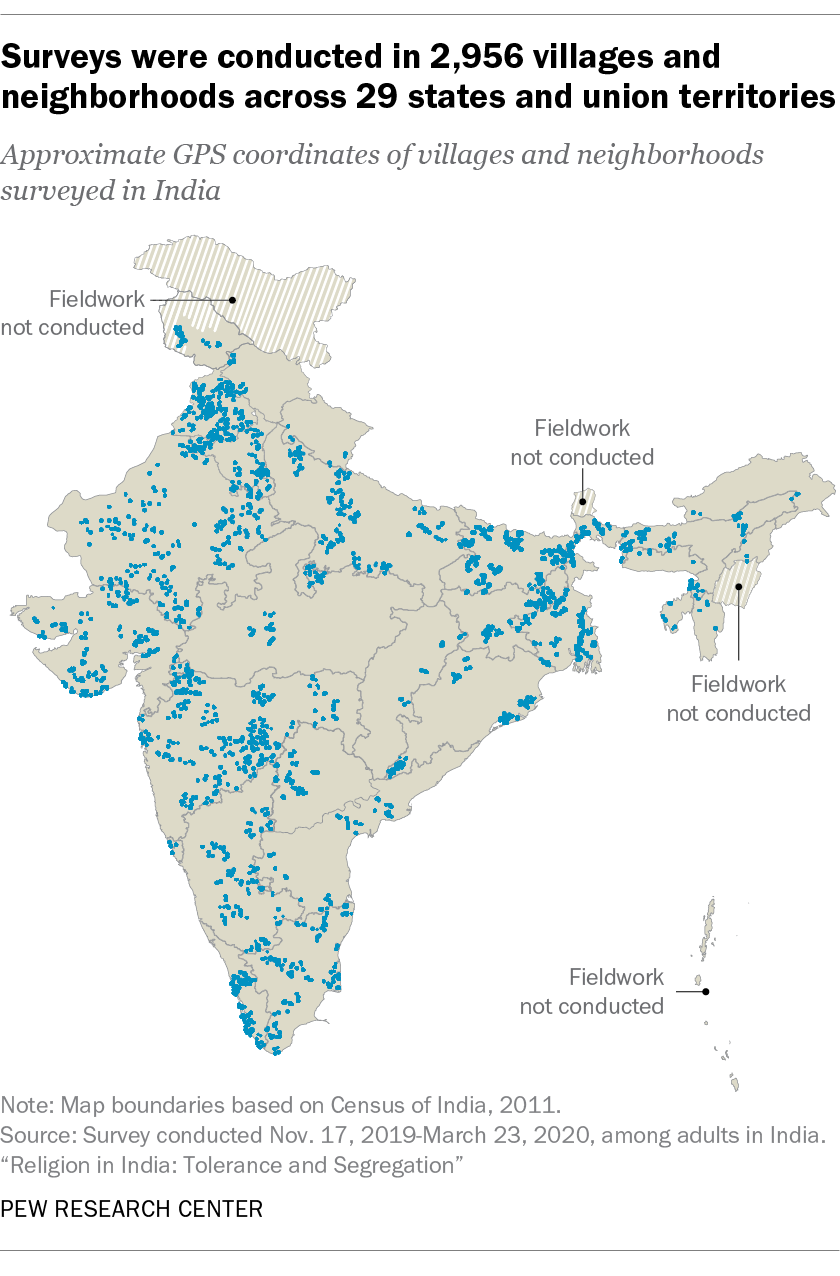
We took many steps before selecting individual respondents to take part in the survey. First, we sampled districts from most states and union territories across India. (See below for the exceptions.) Within these districts, we then sampled subdistricts. Districts and subdistricts were chosen probabilistically — meaning all of them had a chance of being selected — but we gave certain areas higher chances of selection if they had more hard-to-reach religious groups based on data from the 2011 Indian census. This allowed us to identify areas more likely to be home to religious minority groups. Finally, within subdistricts, we sampled villages and census enumeration blocks (CEBs) with a probability of selection based on their total populations. All this sampling was done from our offices in the U.S., but the next steps required highly trained field teams that were on the ground in India.
Field teams traveled to the roughly 3,000 selected villages and CEBs across 26 states and three union territories in India to conduct interviews. Once at their assigned village or block, the team used a systematic method known in survey parlance as a “random walk” to select the houses to contact. Although it is called a random walk, the procedure is actually quite detailed. The process had the teams start at a particular location within the village or block, such as at a school or the village leader’s residence. Then they walked along the road and approached every nth house or dwelling, according to a predetermined skip interval. This interval was based on the total number of houses in the village or block, as provided by the village leader. This process resulted in the teams covering the entire village or block, while randomly selecting 12 households where they would attempt an interview. Then, with cooperation from a household member, the interviewer created a list of all the adults living in the household, a process known as enumeration. Finally, one eligible household member was randomly selected to complete the survey. (If you want to learn more about the study’s sample design, all details are listed in the report’s appendix.)
How did you prepare for data collection?
To implement data collection projects of this magnitude, we typically work with other firms to help draw the samples and manage the fieldwork. For this study, we worked with RTI International, an international research organization with ample experience in India. RTI also enlisted the support of two local firms with the interviewing capacity necessary to carry out a project of this scope. Because of the complexities in this particular study, we did a test of the questionnaire and all procedures to be implemented in the study — commonly known as a pilot test — months before we planned to conduct the main fieldwork. Our pilot test consisted of 2,045 interviews in four states and six languages, which helped test all survey protocols, interviewer training processes and field logistics. The pilot test also ensured that all the parties involved — from the interviewers in India to the researchers in Washington, D.C. — were working in lockstep and ready for any challenges that might arise.
After the successful pilot test, we needed to transition from a test of about 2,000 interviews to 30,000 interviews across all of India. This leap was not possible without standardized protocols and well-trained staff on the ground. Accordingly, fieldwork for the main study began with a staggered rollout of trainings across India to prepare nearly 200 teams of interviewers and supervisors. These intensive five-day trainings included classroom learning, role play exercises and at least one survey “practice day” in a nearby neighborhood so interviewers could acclimate themselves to conducting the survey under real-world conditions. Once fully trained, these teams, which consisted of one supervisor and two interviewers, began visiting assigned areas to conduct interviews.
Researchers from Pew Research Center visited India throughout the project, including during the pilot project and the main field training. They were able to monitor the work, make any necessary adjustments immediately and learn firsthand about the challenges field staff faced.
What were some of the challenges you faced and how did you overcome them?
We always face challenges when conducting research. One way this study differed from our past surveys in India was that it was about sensitive topics such as religious identity and attitudes toward other religious groups.
To ensure we were conducting the research ethically, and in keeping with local research norms, we sought and received approval from an institutional research review board (IRB) within India. To alleviate participants’ concerns about being approached for an interview, field supervisors first gained cooperation from local leaders or village heads before their interviewers began fielding questions in the area. Local leaders could then reassure community members that the team was conducting legitimate research and could be trusted. The interviewers also provided written and verbal details to the respondents on consenting to the survey, including their ability to refuse any question asked and to end the interview at any time, as their participation was completely voluntary.
Safety concerns in some regions of the country, particularly in the Kashmir Valley, were another challenge during the fieldwork period. Prior to our fieldwork, the Indian government implemented lockdowns and curfews, as well as communications blackouts in the region. To keep our field teams safe, interviews that were supposed to be conducted in Kashmir Valley were reallocated to other Muslim-majority areas, including locations in Jammu, Haryana and West Bengal.
Further, while the survey was being conducted, demonstrations broke out in several regions against the country’s new citizenship law that would expedite citizenship for followers of certain religions, excluding, most notably, Muslims. Our fieldwork in West Bengal and Delhi was delayed because of associated security concerns and local curfews.
Another unexpected challenge we faced in all of the Center’s 2020 face-to-face research was the COVID-19 pandemic. Out of safety concerns for our interviewing teams and survey respondents, we stopped fieldwork just shy of our overall project goal, leaving 1.3% of the sampled villages and blocks unsurveyed. While this may seem like a very small amount, it meant we never conducted fieldwork in Sikkim and Manipur states, and therefore our national results excluded these areas.
Even with these handful of challenges in our study, we were able to complete an in-depth representative survey of the nation, its regions and its six major religious groups.
CORRECTION: An earlier version of this post misstated the number of interviews that were part of Pew Research Center’s pilot test in India. There were 2,045 interviews, not 1,948.


