

Politicians and political groups regularly use social media to disseminate their views to constituents, supporters and others. But some political figures have more reach than others. In the United States, for example, the most liberal and most conservative members of the 115th Congress had more Facebook followersthan their moderate counterparts, as Pew Research Center has found. The same pattern holds when looking at congressional lawmakers’ Twitter accounts.
Does this same phenomenon apply outside the U.S.? This is a difficult question to answer. But an initial analysis shows that, across 12 European countries, parties on the far left or right of the ideology scale aren’t more popular on Twitter than their more moderate counterparts. In this post, we’ll explain how we arrived at this preliminary finding and why expanding this kind of analysis beyond the U.S. is trickier than it sounds.
Different measures of ideology
Our previous work in the U.S. used an ideology score known as DW-NOMINATE, which measures the ideology of members of Congress based on their roll call voting records. DW-NOMINATE is widely used in the research community, but it is only available for U.S. legislators. Moreover, this sort of measure doesn’t easily translate to other countries, especially in the roughly 40% of nations under some form of autocratic or single-party government rule.
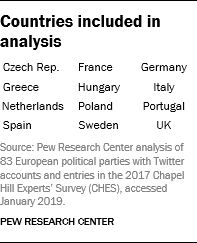
In an effort to see if we could identify an alternative source of objective ideology scores that might work in an international context, we turned to the University of North Carolina’s 2017 Chapel Hill Experts’ Survey (CHES). We also decided to focus specifically on 12 European Union countries.
The survey data
The 2017 Chapel Hill Experts’ Survey asked a group of 228 political scientists around the world to score 132 European political parties on a variety of measures, from their views of multiculturalism to their preferred economic policies. Most important for the purposes of this analysis, the survey also included a right-left ideology scale.
Multiple experts assign values to each party across all indicators, leaving the final point estimate allotted to each party for each variable — including ideology — as the mean of all experts’ scores. This sort of collaborative scoring scheme allows for a fairly consistent evaluation of the same standards across multiple countries. Academics and previous Pew Research Center projects have used the 2017 CHES data when classifying parties based on anti-elite sentiment and ideology.
The social media data
The analysis involved building a new dataset of Twitter handles for European political parties alongside the number of people following each party’s account. We compiled a list of political parties from across Europe and matched it to those included in the 2017 CHES survey. We then searched for each party on Twitter, using both their English name and the native language translation, to compile the list of handles. We could have also recorded the number of followers for each party at this stage in our research, but the counts on the Twitter website are less precise than those obtained via Twitter’s public API.
To collect information on each party’s Twitter following, we used the “rtweet” package in R, the open-source statistical program. This library allows users to access information via the Twitter API for all public Twitter accounts, including the number of followers they have, the language of their tweets and the text of their Twitter bios. To use this function, however, we first had to apply for a Twitter developer account, which enables you to register your app/project with the company and access their data.
Since we were only interested in the number of followers for each political party’s Twitter account, we used the “lookup_users” function within the “rtweet” package. After manually compiling the list of political parties’ Twitter handles, we executed the following lines of code to extract Twitter data for each user.
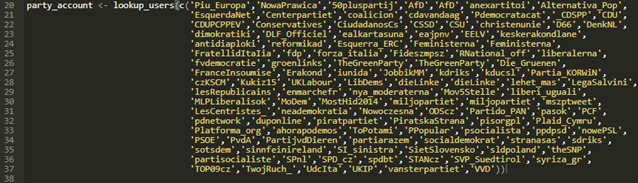
Running that code returns a tibble data frame with one row for each party and 90 variables, including the user’s listed location, language of the last tweet, user-provided biography and the number of followers. Since the information is collected almost simultaneously, we have more confidence that the followers for each party are comparable.
After collecting follower counts, we removed columns containing data we didn’t need and merged the social media data with the CHES dataset. Not all parties in the CHES dataset have active Twitter accounts, but we were able to collect this data for 112 of the 132 parties in the dataset.
Exploratory analysis
Ultimately, we decided to drop parties whose Twitter accounts have fewer than 10,000 followers. We excluded these parties because they were not very active on Twitter, did not have accounts that were clearly official in nature, or existed to promote more narrow causes that didn’t necessarily tell us much about political ideology in general. This left us with 83 parties across 12 countries, with a median Twitter following of 85,000.
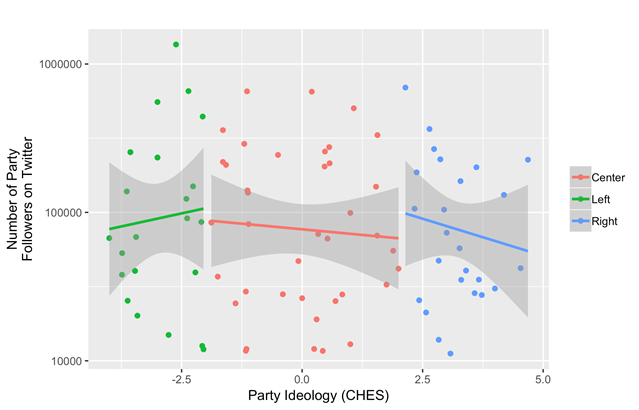
We next divided the sample of parties into three categories based on the CHES ideology scale, which we re-centered from 0 to 10 to -5 to 5. The categories include left parties (-5 to -2 on the scale), center parties (-2 to 2) and right parties (2 to 5). When graphing party ideology versus the log number of Twitter followers, we observed that more ideological parties tended to have modestly fewer Twitter followers:
Estimating a random-effects model to explore the pattern
The scatterplot does not take into account the fact that each political party’s number of followers could be affected by factors such as a country’s population, rates of Twitter use or education levels. As a result, we decided to estimate a multi-level model with separate intercepts for each country to further examine ideology’s effect on Twitter following:
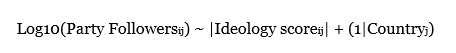
This allows us to predict the number of followers a party has on Twitter based on the absolute value of their ideology score and gauge how “extreme” they are in either direction. The random effects help account for unobserved attributes of countries that might influence the number of people who follow parties (and thus make cross-country comparisons more difficult). In this case, we assumed that different countries’ Twitter usage rates are not correlated with parties’ ideological extremity, for example.
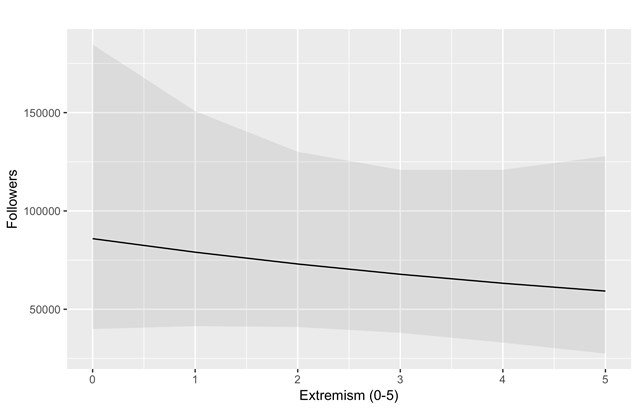
We found that absolute value of ideology has a negative but statistically insignificant relationship with popularity. In other words, we don’t find evidence that far left and right parties have systematically more Twitter followers. However, a fully specified model that also captures attributes like a party’s overall popularity or other attributes of a party might find different results.
Challenges and next steps
As noted earlier, this analysis suggests that European political parties on the far left or right of the ideology scale aren’t any more popular on Twitter than their moderate counterparts. However, the comparison to our earlier U.S. findings is imperfect for several reasons. For one, legislators are not the same as parties. And while the U.S. ideology measure is based on roll call voting records, the European scale is a composite of subjective experts’ scores. Without cross-country legislator-level ideology estimates that are consistent across countries, we are limited in our ability to directly replicate the U.S. analysis. Still, this initial finding provides an interesting basis for further analysis of cross-country patterns in European politics.