Several posts on this blog have examined unsupervised methods of natural language processing. These algorithms and models can help researchers explore and analyze large amounts of text. But as those posts point out, a supervisedapproach — one in which researchers train a classification model to make new predictions based on of a set of human-labeled documents — is often a better way to measure interesting concepts in text.
A recent Pew Research Center report used supervised methods to examine over 700,000 Facebook posts published by members of Congress between Jan. 1, 2015, and Dec. 31, 2017. The project’s goal was to classify whether lawmakers in Congress expressed political support or opposition in those posts, as well as to see how often they discussed local issues.
In the following discussion, we’ll describe how we used human coders to capture particular kinds of rhetoric in a small sample of congressional Facebook posts and then applied those decisions across the entire set of posts using machine learning. We are also providing a dataset that summarizes how often each member of Congress takes sides and “goes local” on Facebook. (More about the dataset later.)
Putting together a supervised classification project starts with researchers deciding what they want to measure. In our case, we wanted to capture expressions of political support and opposition directed at key political figures and groups. These included Donald Trump, Barack Obama, Hillary Clinton and Democrats/liberals or Republicans/conservatives more generally. We also sought to measure how often politicians focus on local topics by capturing references to any place, group, individual(s) or events in the home state or district of the politician who created the Facebook post.
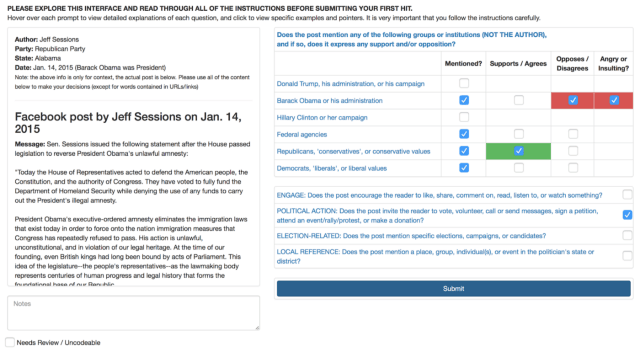
Once we decided on these key measures, we put together a coding instrument: a computer interface that showed each Facebook post in our training dataset, some information about when it was posted and who posted it, and a set of questions for human coders to answer. The full interface looked like this:

We used Amazon’s Mechanical Turk online outsourcing service to hire coders to complete much of the classification. Overall, Mechanical Turk workers examined 11,000 Facebook posts by members of Congress, and we classified an additional 1,100 ourselves using the same system. (Every post classified via Mechanical Turk was evaluated by five separate Mechanical Turk coders, while every post classified at the Center was evaluated by two of the Center’s researchers.) This human classification project helped us assemble the training dataset: a large sample of posts that had been transformed from words into quantifiable kinds of rhetoric.
When assembling training data, researchers sometimes take a random sample of their entire dataset. But in this case, we wanted to be sure that the posts we selected for human classification contained our key concepts of interest. To do this, we used keyword over-samples to increase the rate at which posts expressing political support or opposition showed up in the training data. For example, we used regular expressions like “[Ll]iberal*|[Dd]emocrat*|[Pp]rogressiv*” to select posts that might contain support or opposition to Democrats and/or liberals, and randomly selected those posts at a higher proportion than they would otherwise appear. Those words appeared in 6% of the Facebook posts overall, but were present in 32% of the posts in the training sample we asked Mechanical Turk workers to classify. Once the coders classified those posts, we used probability weights to adjust for the oversampling in subsequent machine learning and analysis.
There’s an important question to acknowledge at this point: Did the human coders agree with each other? To find out, we computed Cohen’s Kappa — a common measure of interrater reliability that ranges from 0.0 (no agreement other than by chance) to 1.0 (perfect agreement) — across all of the items we planned to use in our analysis. Between the two Pew Research Center coders, we calculated values of kappa that ranged between 0.64 and 0.93 across particular items. Next, we collapsed the five Mechanical Turk classification decisions for each measure into a single value. We then resolved the differences between the researchers here at the Center and compared our final decisions with those made by the aggregated Mechanical Turk workers. The kappa scores for that comparison ranged from 0.65 to 1.0, showing that, when aggregated, Mechanical Turk workers made coding decisions that were comparable to those made by our in-house experts. The full set of kappa values are shown here.
Once we assembled the training data and checked to ensure that the Center’s coders and the Mechanical Turk coders were on the same page, it was time to train the machine learning models. Our goal was to take information about which words go with which concepts (according to our training data) and apply those lessons across all of the posts that our coders didn’t read and evaluate. When training and evaluating the models, we accounted for the keyword oversampling described above, downweighting cases that were disproportionately more likely to appear in the training data.
When applying models based on training data, it may be tempting to use the raw text that you want to measure. But there are several pitfalls associated with doing so. Namely, those models can become overfit to the training data, picking up on noise instead of signal. To minimize that risk, we cleaned the text using a variety of different strategies, taking particular care to remove a wide range of stopwords, including the names of politicians, states, cities, counties, months and other terms that might bias our model predictions toward idiosyncratic features of the training data. This helped protect against the risk that our models might learn to classify posts based on features associated with who made the post, instead of what they said in the post.
The machine learning model we used (called XGBoost) used a specific set of features — attributes of the text — to transform the known human decisions into predictions. The specific features we used are described in the methodology section of our report. When predicting whether a post contained political support or opposition, we trained the models separately for posts created by Democrats and Republicans, but for local issues we used the entire training set.
One especially useful aspect of supervised machine learning is that you can directly assess how well the model works and how sensitive it is to variations in your data through a process known as cross-validation. By training the model with a slightly reduced subset of the human coded data — and holding out a small portion for testing — we can see whether or not the model accurately characterizes the human coded data that it never saw when it was being trained.
Using the 11,000 posts coded by Mechanical Turk workers, we split the data into five equally sized portions and trained the model five separate times, each time omitting a different 20% of the data so we could check how well the model did. Not only did this process help determine whether the models worked, but it also helped us determine prediction thresholds that provided us with the greatest balance between precision and recall. The full results of the cross validation process are shown here. Finally, in addition to cross-validation, we also compared our model’s predictions for the 1,100 posts that Center researchers labeled themselves, to make sure that our models agreed not only with the Mechanical Turk workers, but our own judgments as well.

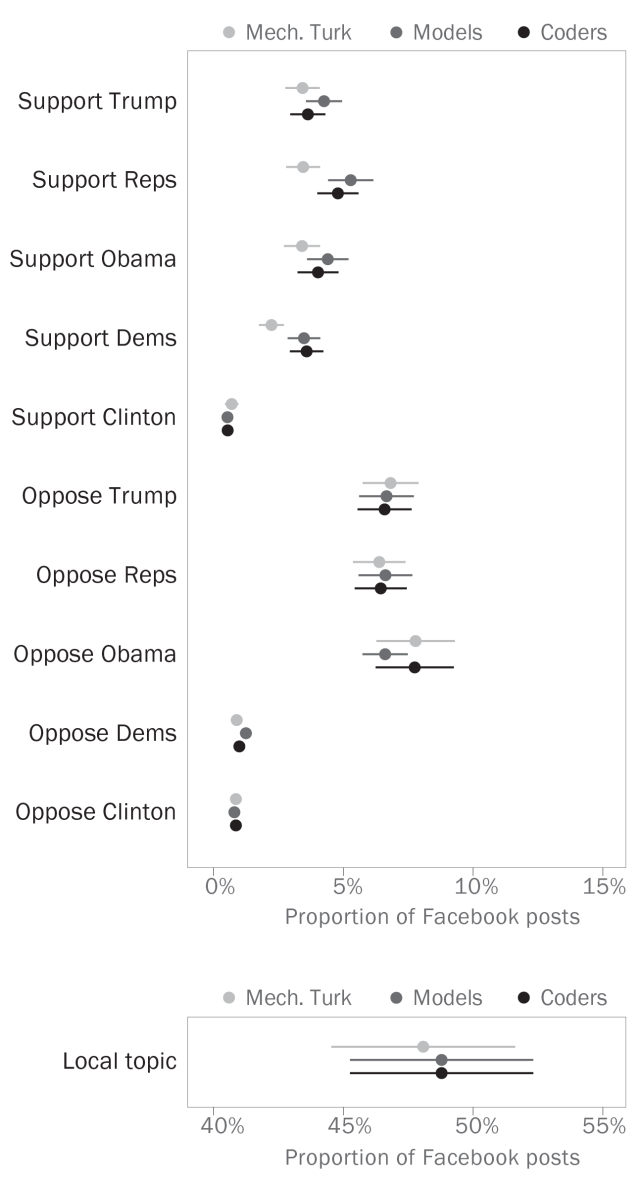
Once we had our predictions, we decided to step back from the individual posts and take a look at the overall rates at which congressional Facebook posts took sides or went local. To do so, we computed the overall weighted proportions of posts that contained each of our topics, based on the machine learning models as well as the Mechanical Turk coders and in-house researchers, and compared the three different overall estimates. Happily, they all seemed to match closely.
Finally, we used these data to look at patterns in which members of Congress took sides, who went local and how the Facebook audience reacted to different kinds of posts. But our research doesn’t have to be the last word on this. We think other researchers and scholars interested in Congress might have their own ideas about how to use these data, so we’re publishing a dataset that contains our estimates of the rate at which individual members of Congress expressed opposition, expressed support or discussed local topics on Facebook. The dataset covers the full 114th Congress and the first year of the 115th Congress and is available here. (You’ll just need to create an account first.)
Please cite the dataset as: van Kessel, Patrick, Adam G. Hughes, and Solomon Messing. 2018. “Taking Sides on Facebook: How Congressional Outreach Changed Under President Trump.” Dataset: Pew Research Center.


