*Visit the most recent data on U.S. Hispanics.
Characteristics of the U.S. Hispanic population: 2015
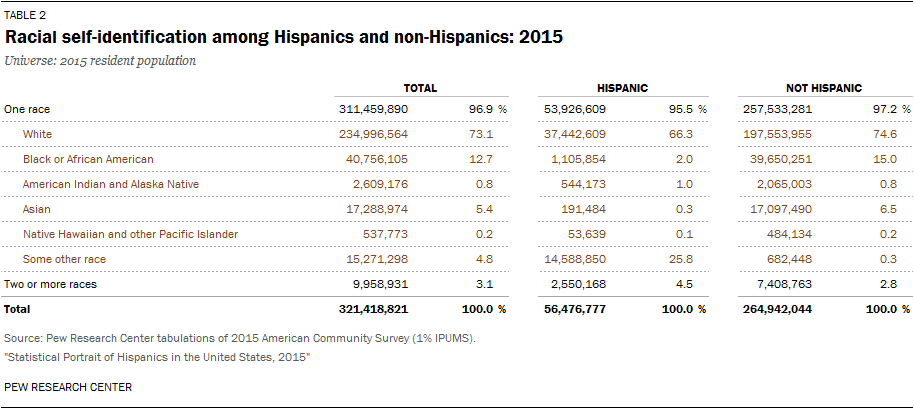
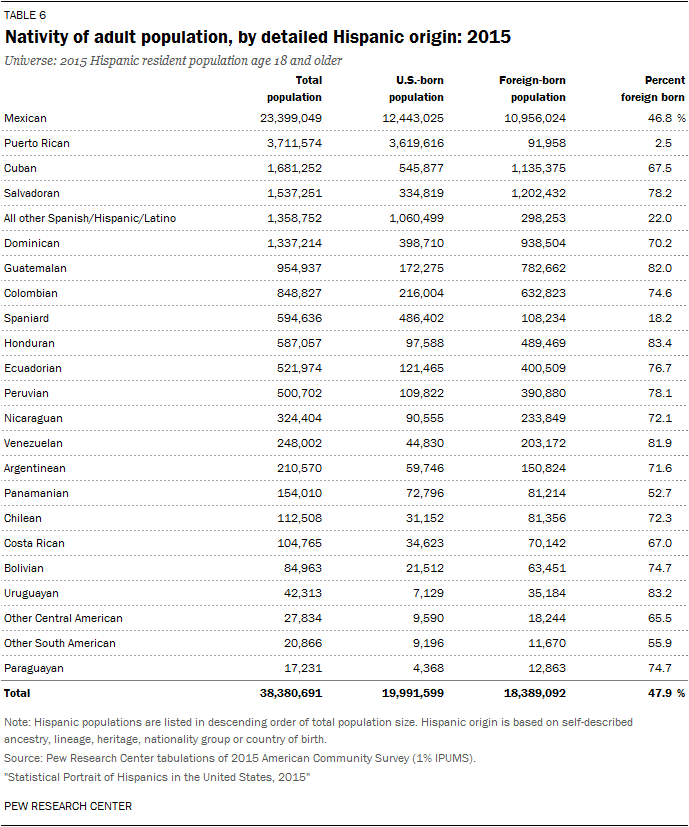
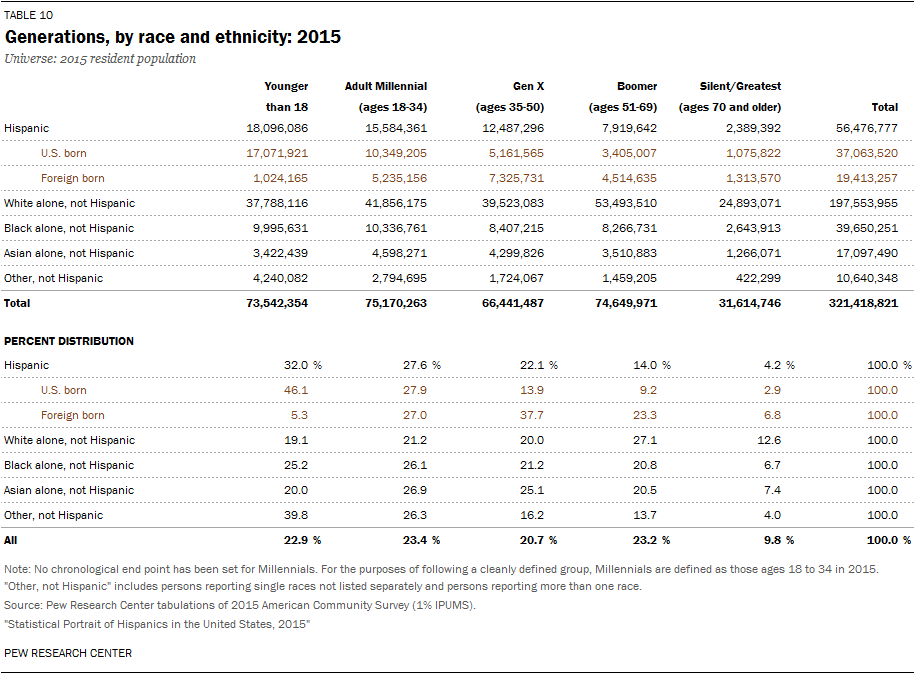
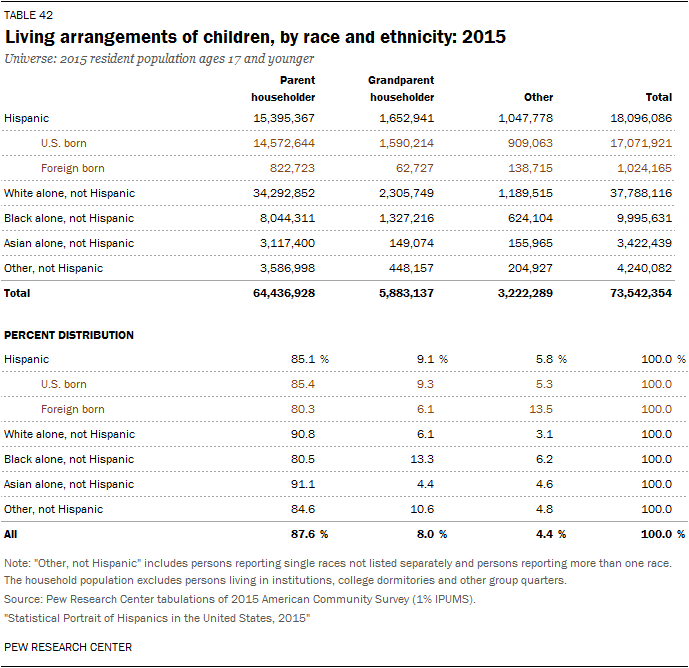
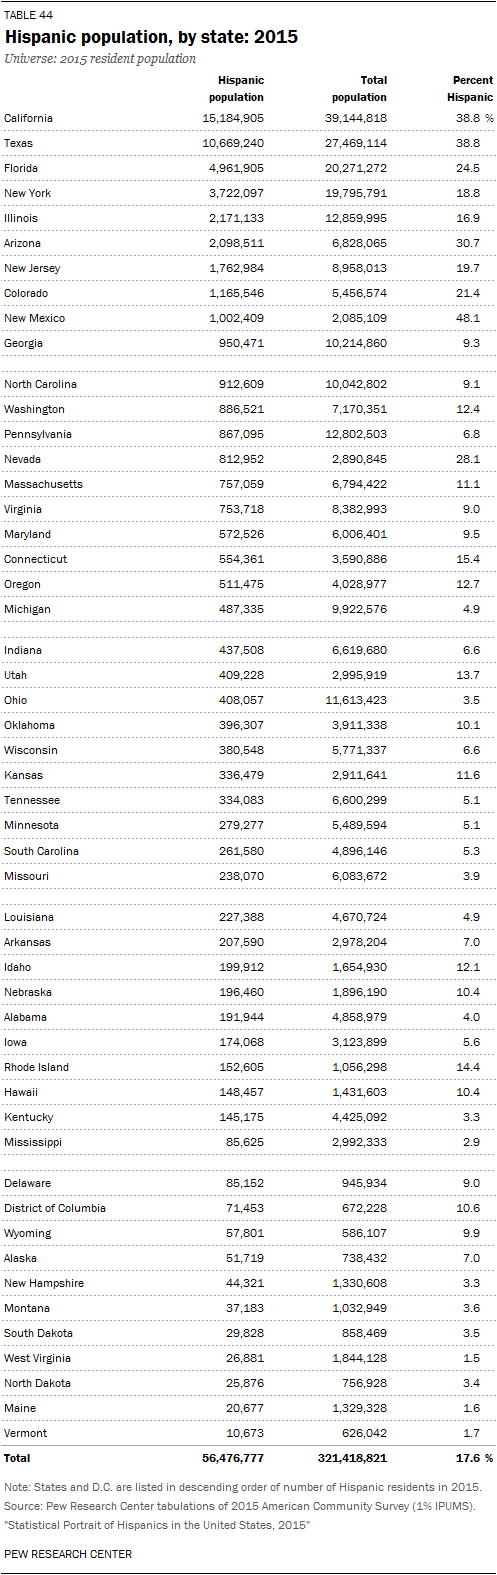
There were 56.5 million Hispanics in the United States in 2015, comprising 17.6% of the total U.S. population. In 1980, with a population of 14.8 million, Hispanics made up just 6.5% of the total U.S. population. Click on the expand buttons below the summary tables to see detailed tables for each.
Click here for a PDF of all the tables below and read the accompanying blog post, “How the U.S. Hispanic population is changing.” Download the Excel workbook.
For a profile of the foreign-born population in the United States, click here.
Population/Hispanic Origin/Nativity/Language Use/Race
| Population (#) | 56,476,777 |
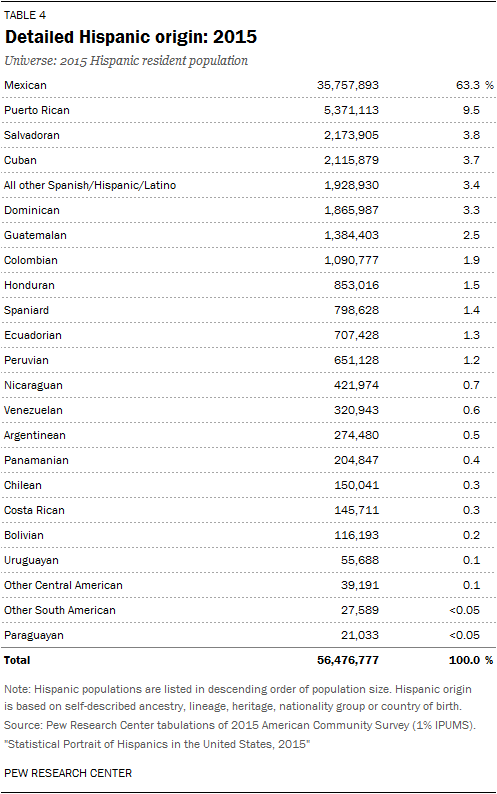
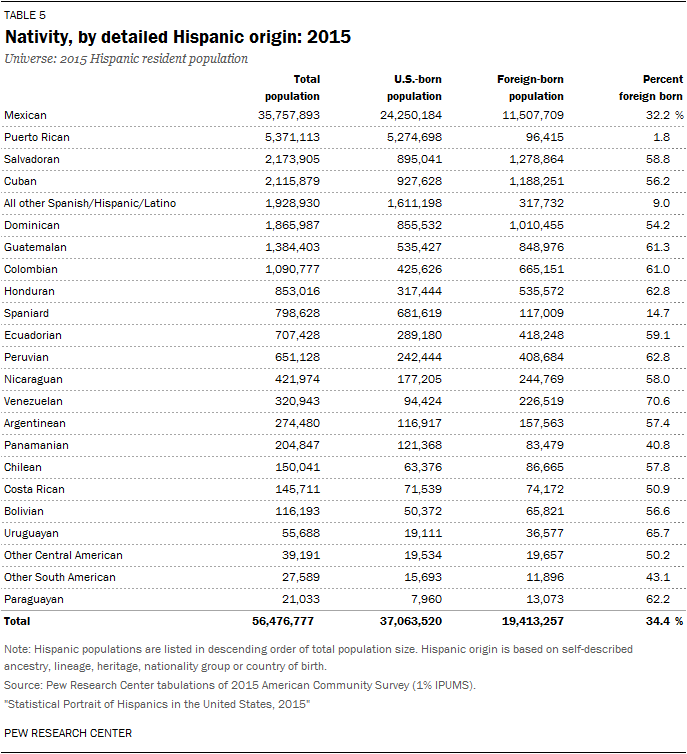
| Mexican | 63.3% |
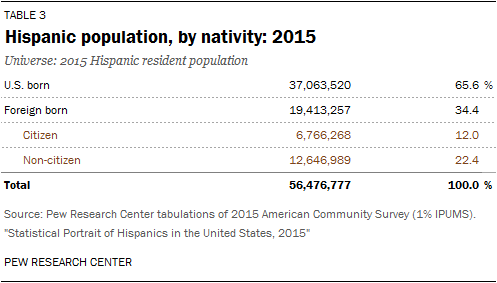
| Foreign born | 34.4% |
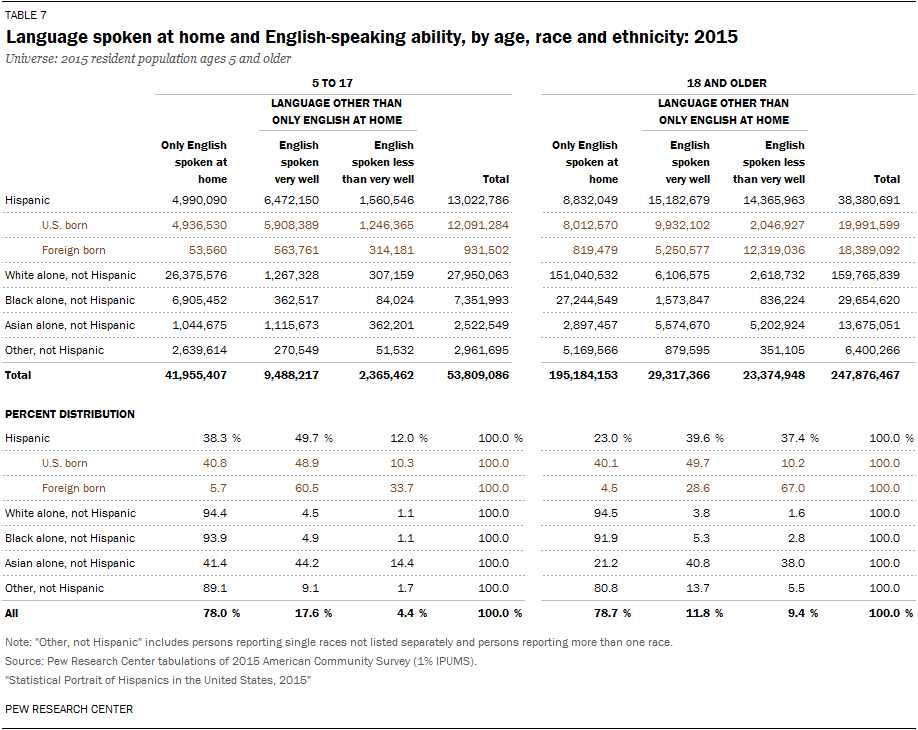
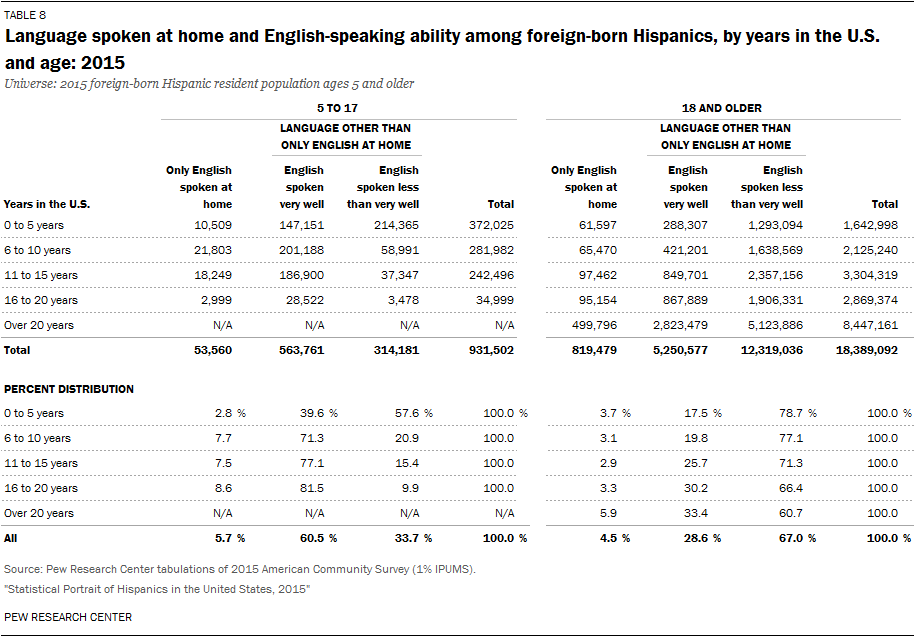
| Speaking English at least very well (ages 5 and older) | 69.0% |
| White | 66.3% |

Age/Gender/Marital Status/Fertility
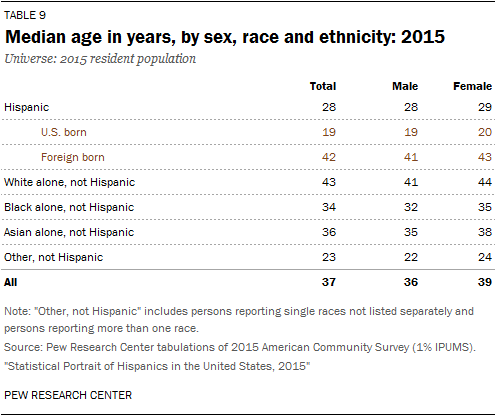
| Median age (in years) | 28 |
| Female | 49.5% |
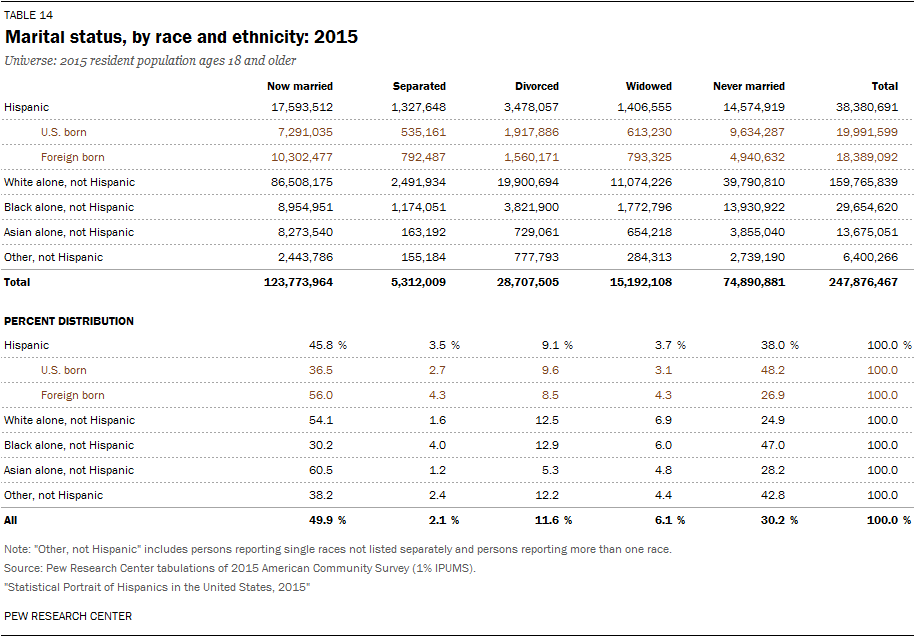
| Married (ages 18 and older) | 45.8% |
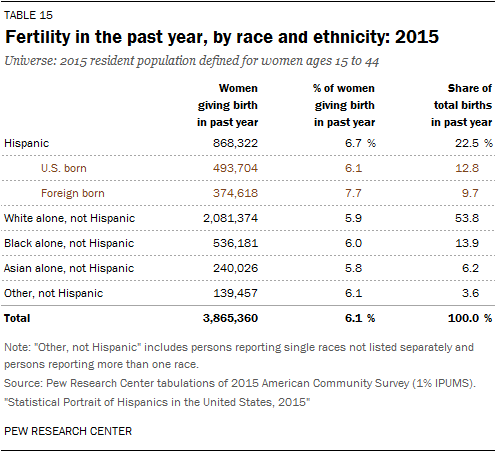
| Women ages 15-44 giving birth in past year | 6.7% |
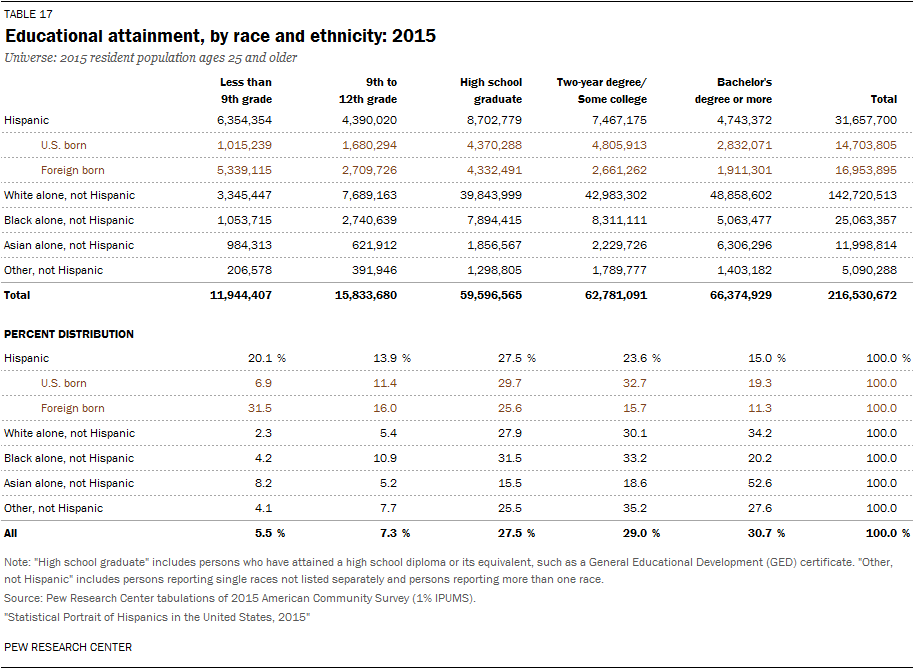
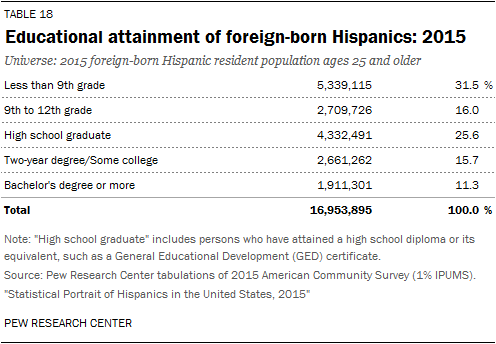
Educational Attainment and Enrollment (highest degree completed, ages 25 and older)
| High school graduate or less | 61.4% |
| Two-year degree/Some college | 23.6% |
| Bachelor’s degree or more | 15.0% |
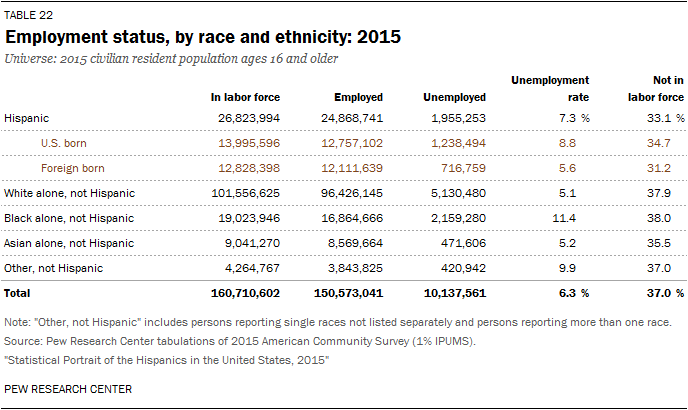
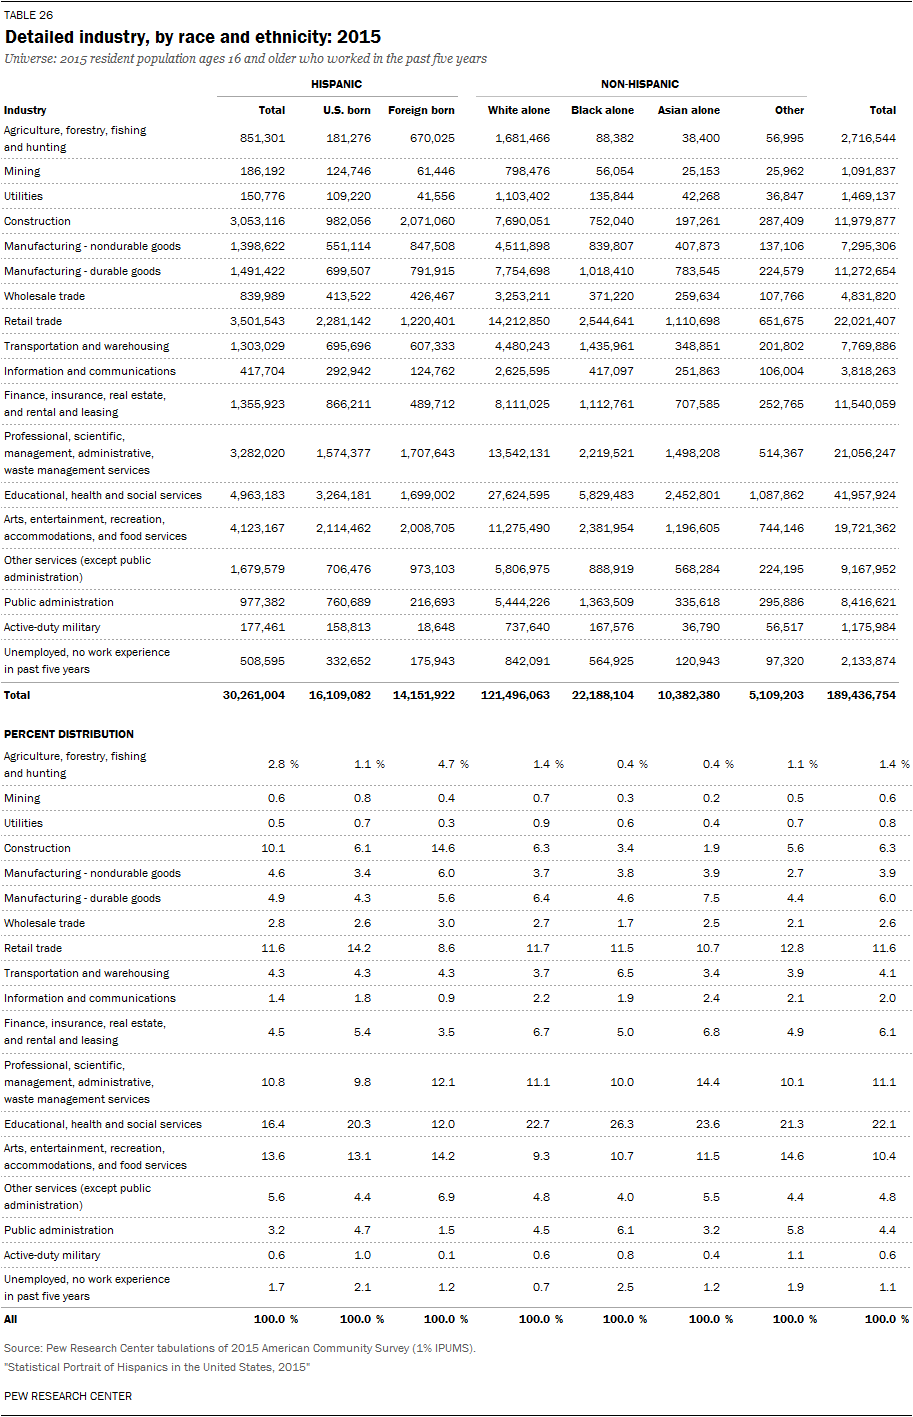
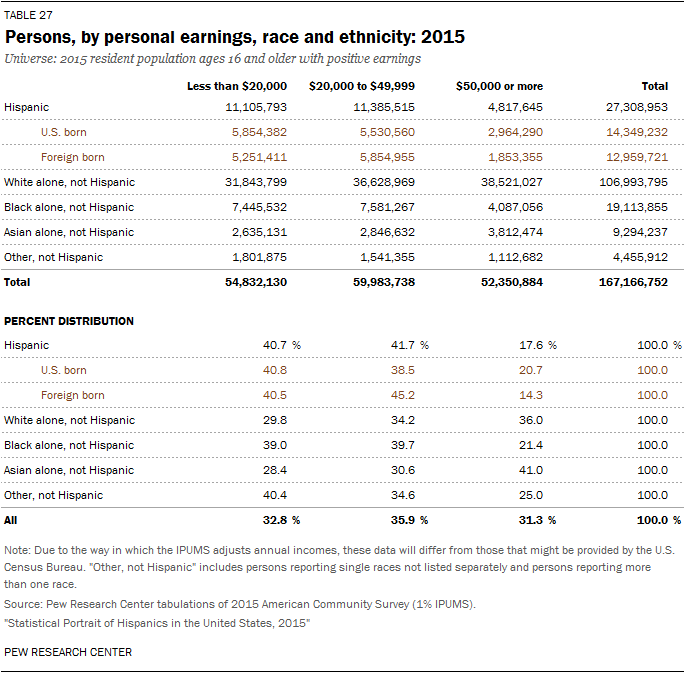
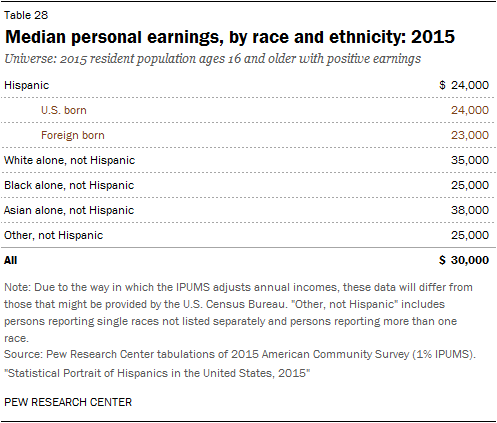
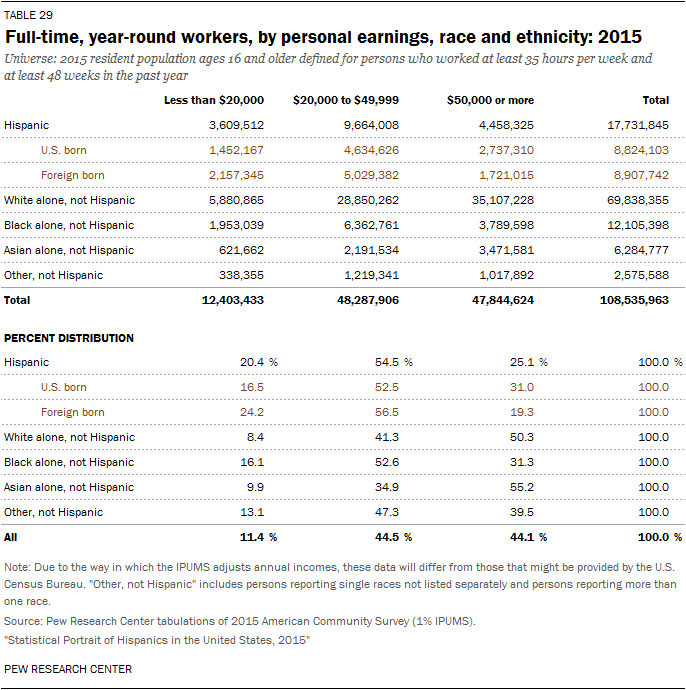
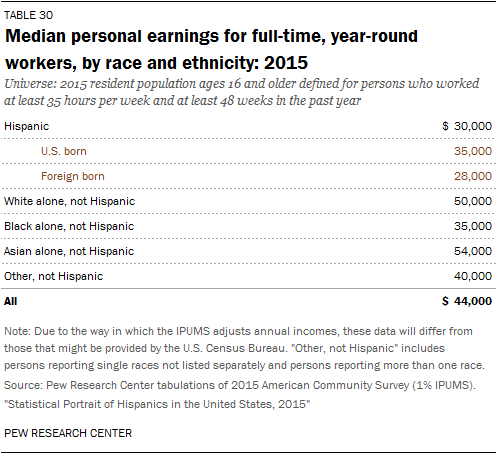
Work/Earnings/Income (ages 16 and older)
| In labor force (among civilian population) | 67.0% |
| Median annual personal earnings (in 2015 dollars, among those with earnings) | $24,000 |
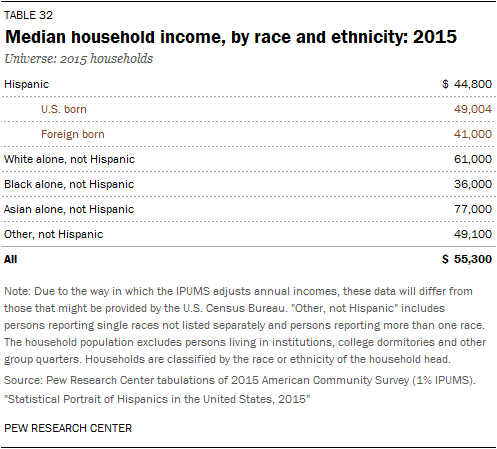
| Median annual household income (in 2015 dollars) | $44,800 |
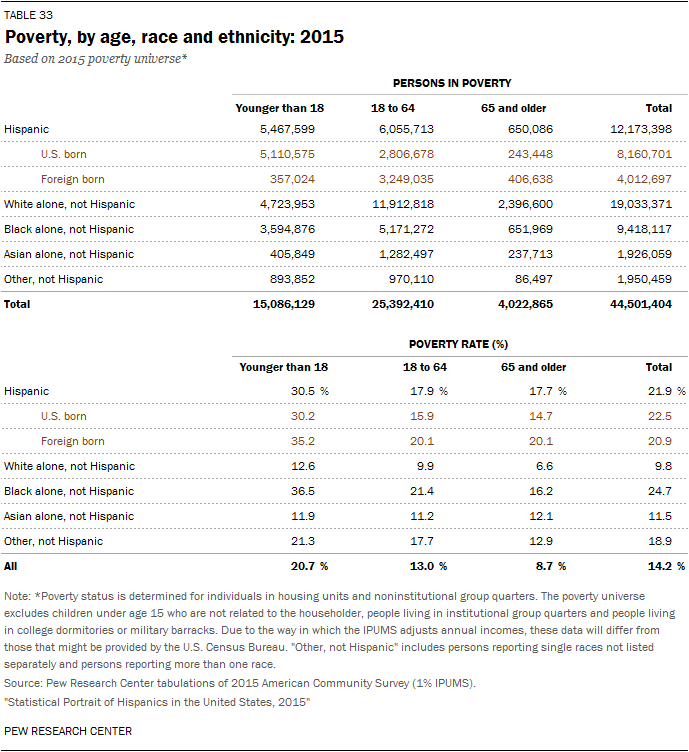
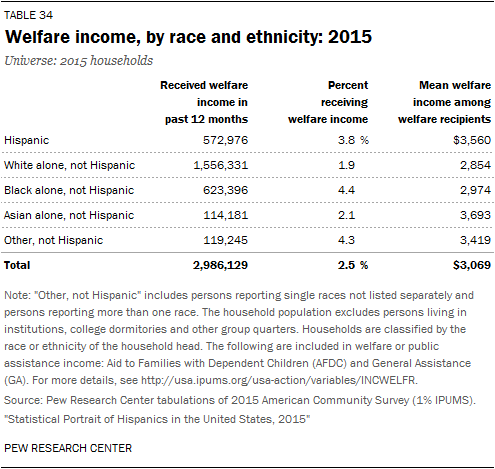
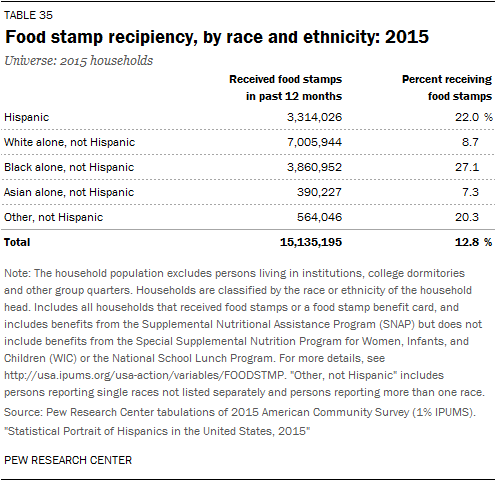
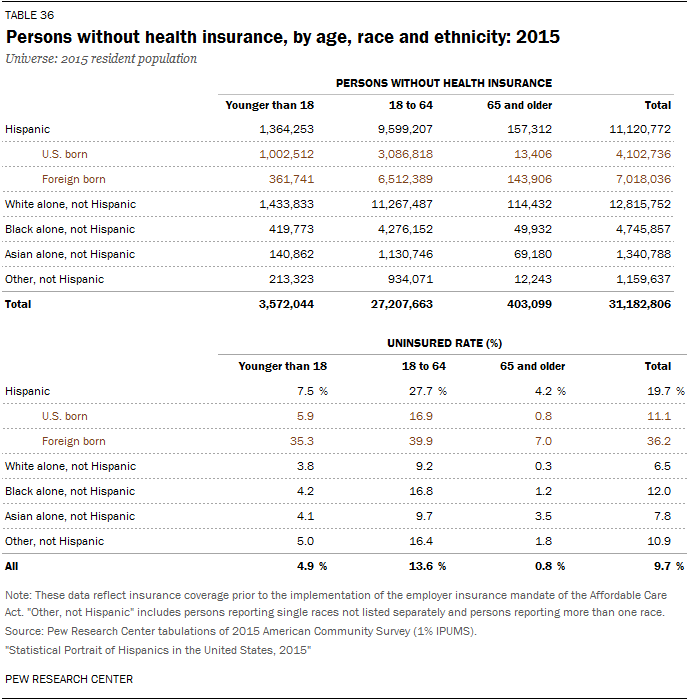
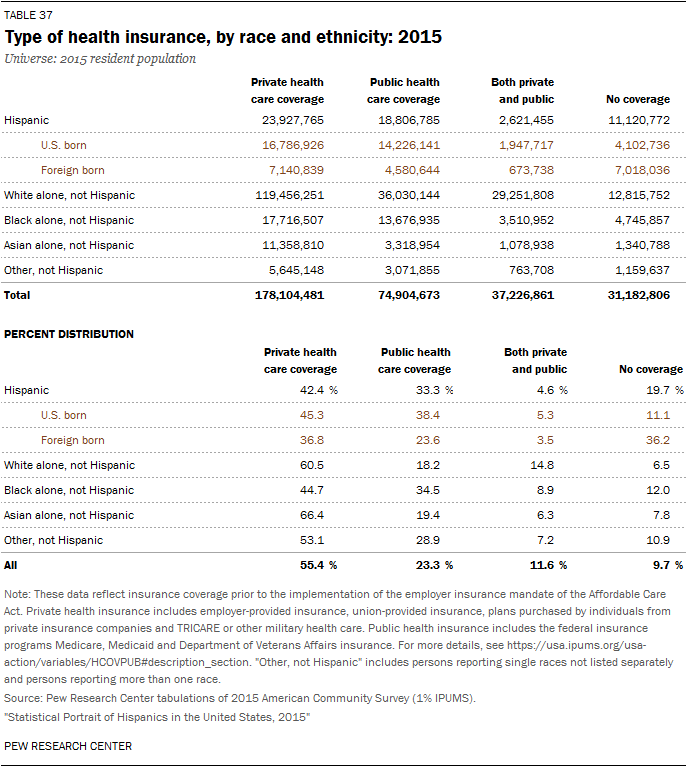
Poverty/Government Assistance/Health Care
| Living in poverty | 21.9% |
| Uninsured | 19.7% |
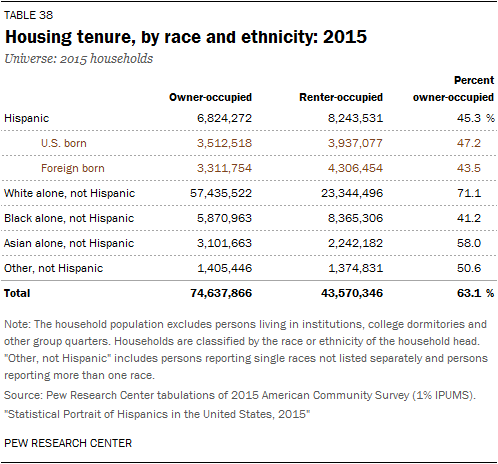
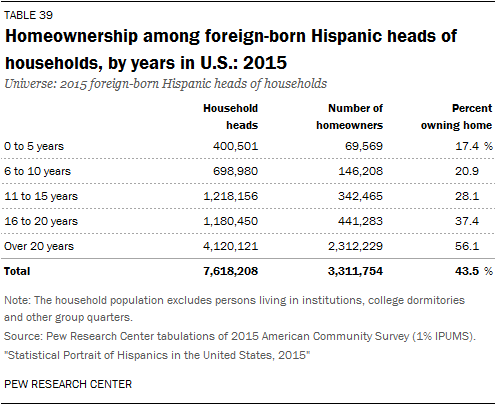
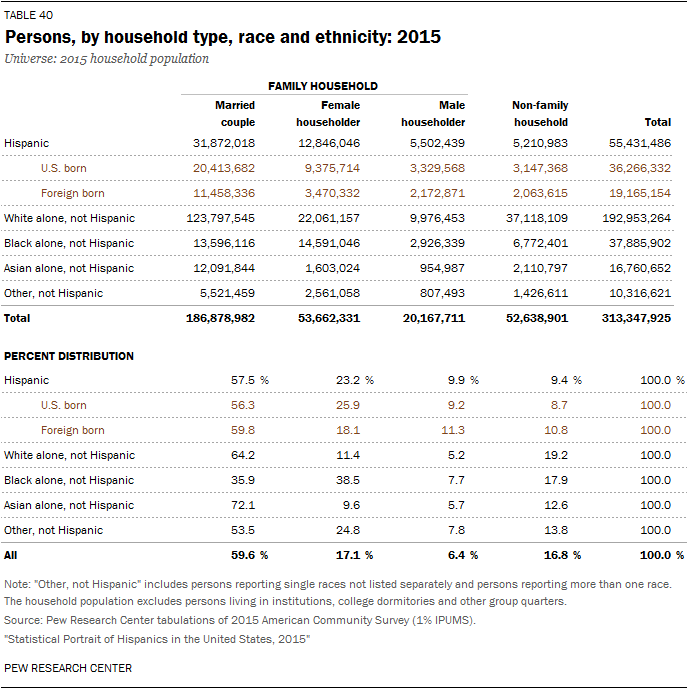
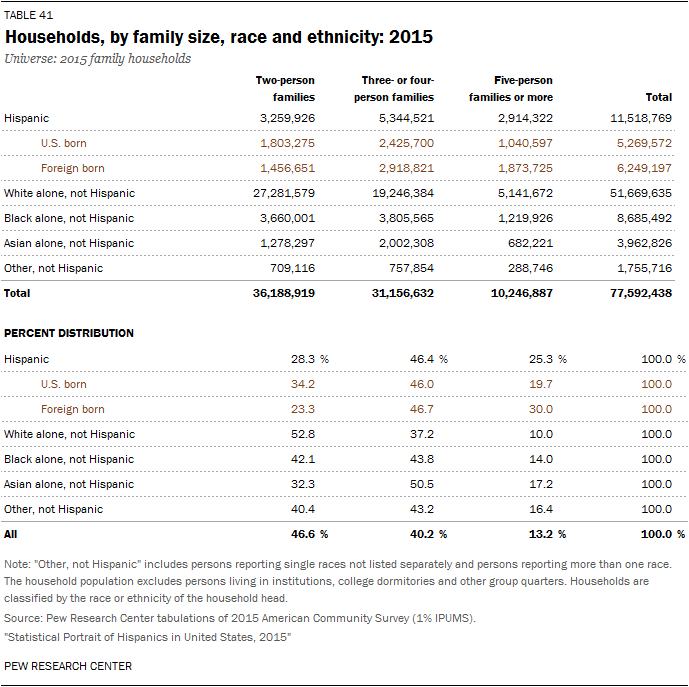
Homeownership and Household Characteristics
| In family households | 90.6% |
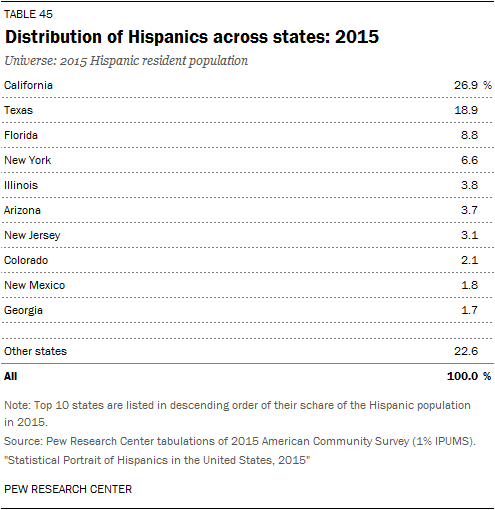
Region and Top Five States of Residence
| West | 40.0% |
| California | 26.9% |
| South | 36.9 |
| Texas | 18.9% |
| Florida | 8.8% |
| Northeast | 14.0% |
| New York | 6.6% |
| Midwest | 9.1% |
| Illinois | 3.8% |

Source: Pew Research Center tabulations of 2015 American Community Survey (1% IPUMS)
“Statistical Portrait of the Foreign-Born Population in the United States, 2015”
