The share of adults in the U.S. who are presently married remains far higher than the share cohabiting. However, an examination of their lifetime experiences, which captures past relationships as well as present ones, tells a different story: Among people ages 18 to 44, a larger share have cohabited at some point than have been married (59% vs. 50%). Moreover, marriage and cohabitation are intertwined, as a plurality of adults (35%) have experienced both of these types of relationships.
Cohabitation today takes on many different forms. The majority of people who have ever cohabited have had only one cohabiting partner, but a significant share (14%) have had a total of three or more. Just over half of cohabiters are raising children, including about a third who are living with a child they share with their partner. The nature of cohabiting relationships varies significantly by race, ethnicity and educational attainment.
As the share of people presently married has declined, an uptick in cohabitation
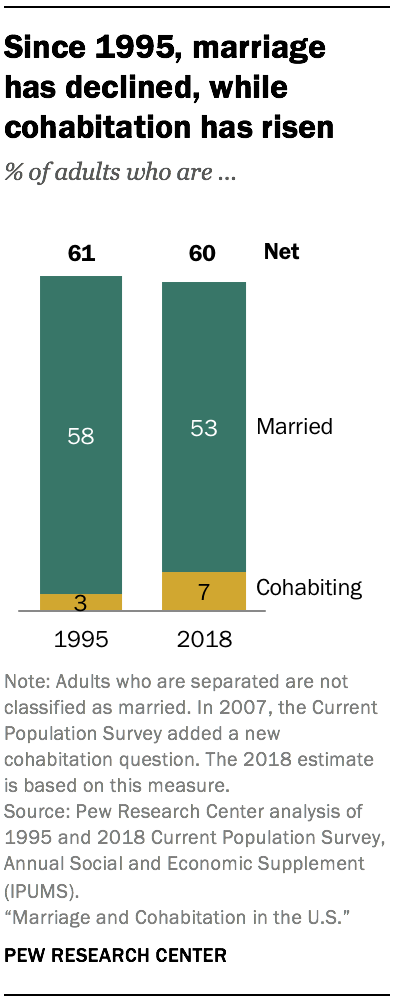
Today, 53% of U.S. adults ages 18 and older are married, down from 58% in 1995. Over the same period, the share of Americans who are cohabiting has risen from 3% to 7%.4
Taken together, six-in-ten Americans are either married or living with a partner, a share that has remained largely unchanged since 1995.
Over the past few decades, marriage rates have declined, particularly among younger Americans. Today, 18% of adults younger than 30 are married, compared with 31% in 1995. Among adults ages 30 to 49 and those 50 and older, 62% are married – down somewhat from 1995, when marriage rates for these age groups were 68% and 65%, respectively.
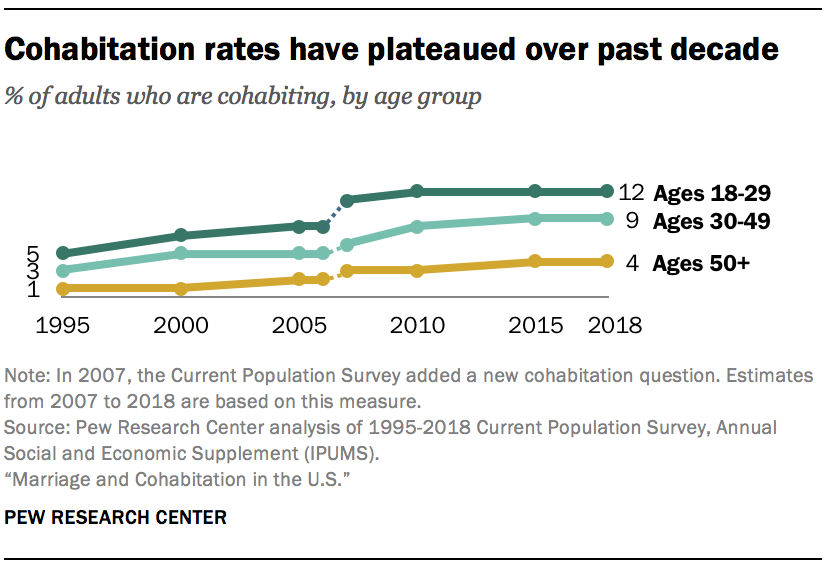
At the same time, cohabitation rates have increased across all age groups since 1995, though this growth has slowed in the past decade. Among adults younger than 30, 12% are now living with an unmarried partner, compared with 5% in 1995. By comparison, 9% of adults ages 30 to 49 and 4% of adults 50 and older are cohabiting (up from 3% and 1%, respectively, in 1995).
There is substantial variation in marriage rates by race and ethnicity. While 57% of white adults and 63% of Asian adults are married, fewer than half of Hispanic (48%) and black adults (33%) are. Since 1995, marriage rates have declined among white, black and Hispanic adults, but for Asian adults they have stayed roughly constant. Cohabitation rates are more consistent across racial and ethnic groups – 8% of whites and Hispanics and 7% of blacks are cohabiting, as are 3% of Asians. Cohabitation has risen more among white, black and Hispanic adults in recent decades than it has for Asian adults.
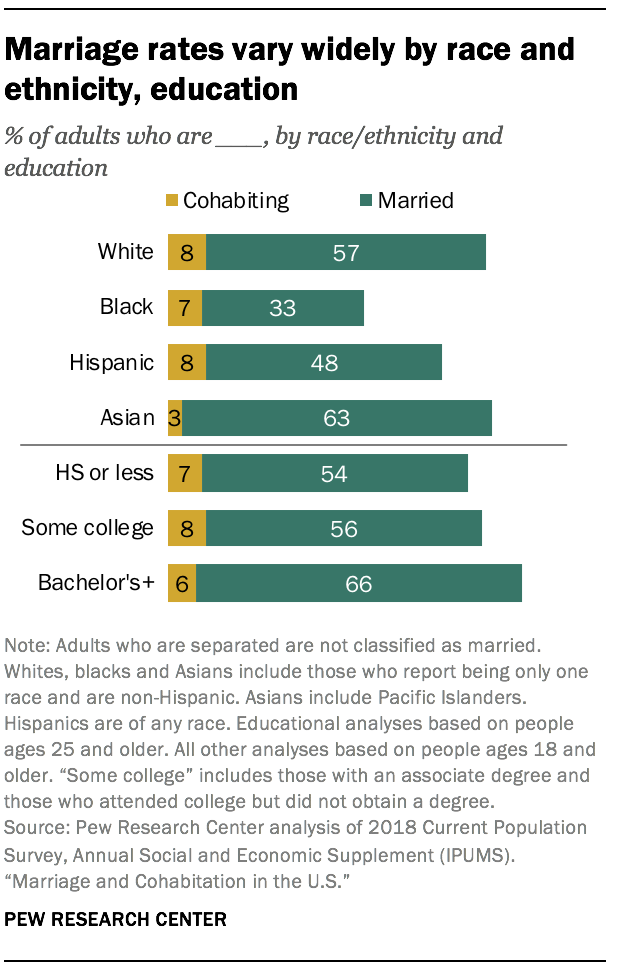
Marriage rates also vary by education. Among people ages 25 and older, those with a bachelor’s degree or higher (66%) are more likely than those with some college experience (56%) or with a high school diploma or less education (54%) to be married. These differences were less pronounced in 1995, when 70% of college graduates were married, compared with 66% of those with some college and 62% of those with a high school education or less. This education gap is evident among black and white adults, while educational differences in marriage rates are smaller among Hispanic and Asian adults.
The share of adults in cohabiting relationships has risen across all educational levels. Among those ages 25 and older with a bachelor’s degree or more, this increase in cohabitation offset the decline in marriage, and as a result the share of college graduates who are either married or living with a partner is unchanged since 1995. Among those with less education, however, the increase in cohabitation only partially counteracts the decline in marriage. Consequently, adults without a bachelor’s degree are somewhat less likely to be either married or living with a partner today than in 1995.
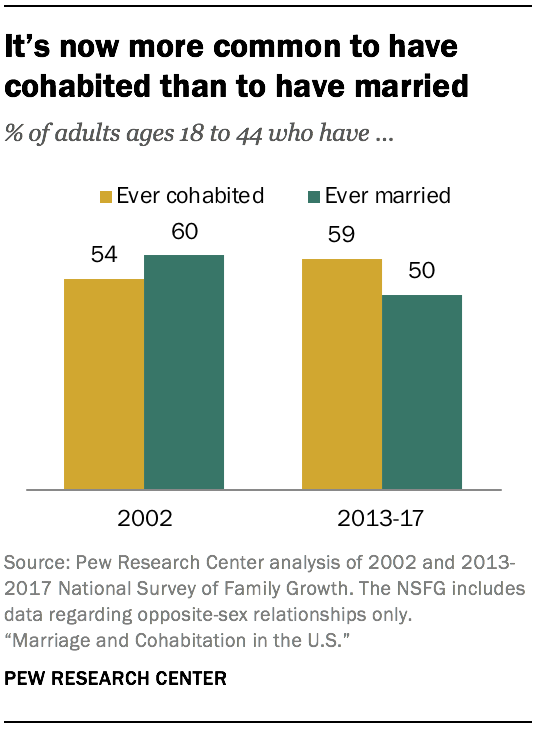
A majority of adults 18 to 44 have cohabited at some point in their lives
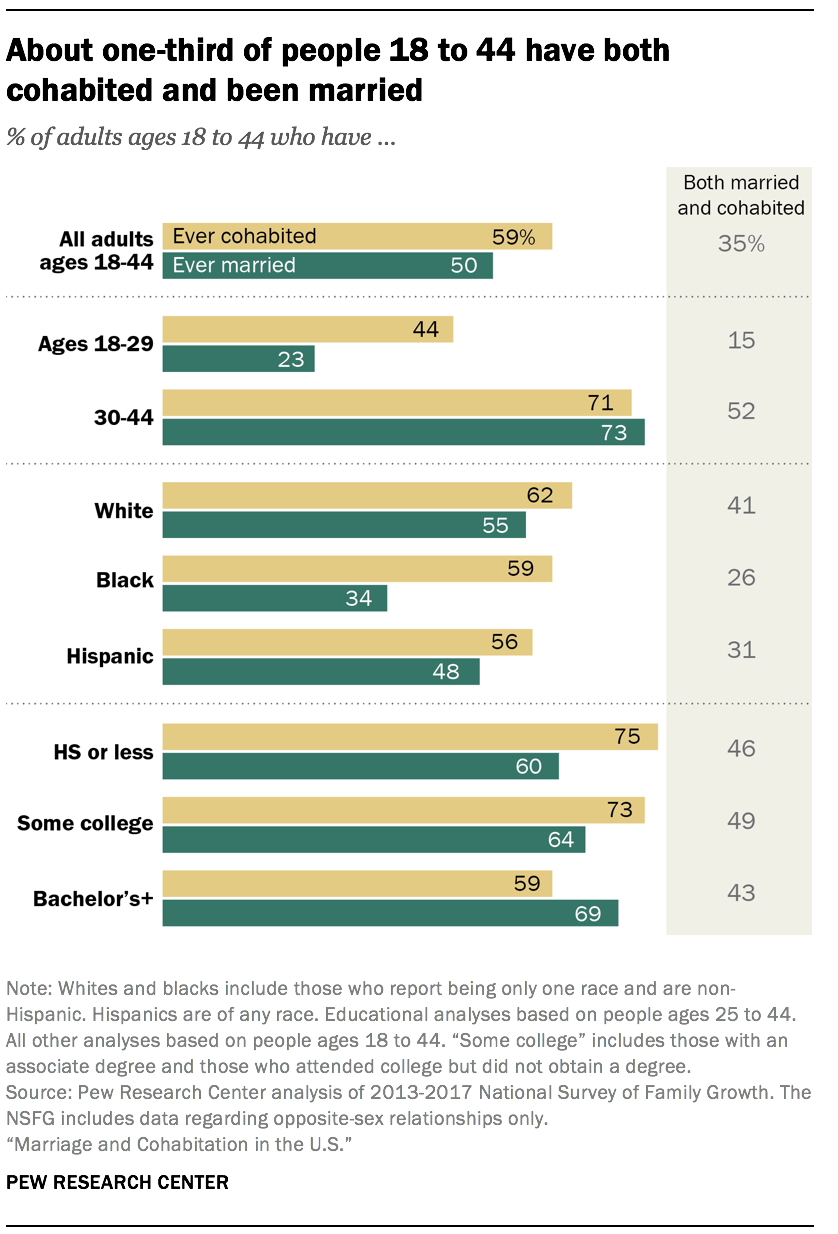
Among adults ages 18 to 44, the share who have ever cohabited (59%) is now larger than the share who have ever been married (50%). This represents a significant change from roughly a decade ago, when 54% of adults in this age group had ever cohabited and 60% had ever married, according to data from the National Survey of Family Growth (NSFG).5
The share of adults ages 18 to 44 who have experienced both marriage and cohabitation is 35%.6 About one-in-four adults (23%) have only cohabited, 15% have only married and 26% have done neither.
Young adults – those ages 18 to 29 – are almost twice as likely to have cohabited as they are to have married (44% vs. 23%), while the largest share (48%) have done neither. Meanwhile, among those ages 30 to 44, the share that has cohabited (71%) is similar to the share that has married (73%), and 52% have both cohabited and married at some point.
There are differences by race and ethnicity as well. More than half (55%) of white adults ages 18 to 44 have ever been married, as have 48% of Hispanic adults. By contrast, only 34% of black adults have been married. When it comes to cohabitation history, differences across racial and ethnic groups are more modest: 62% of white adults have cohabited, compared with 59% of black adults and 56% of Hispanic adults. Some 41% of whites have both cohabited and been married, as have 31% of Hispanics and 26% of blacks.
At all educational levels, majorities have cohabited at some point, although the rates are lower among the most educated: About three-fourths (74%) of people with less than a bachelor’s degree have cohabited, compared with 59% of those with a bachelor’s degree or more education. Meanwhile, the share who have ever married increases with educational level, from 60% among those with a high school diploma or less to 64% for those with some college and 69% for those with a bachelor’s degree or more.7
Majorities of cohabiters across demographic groups have only lived with one partner
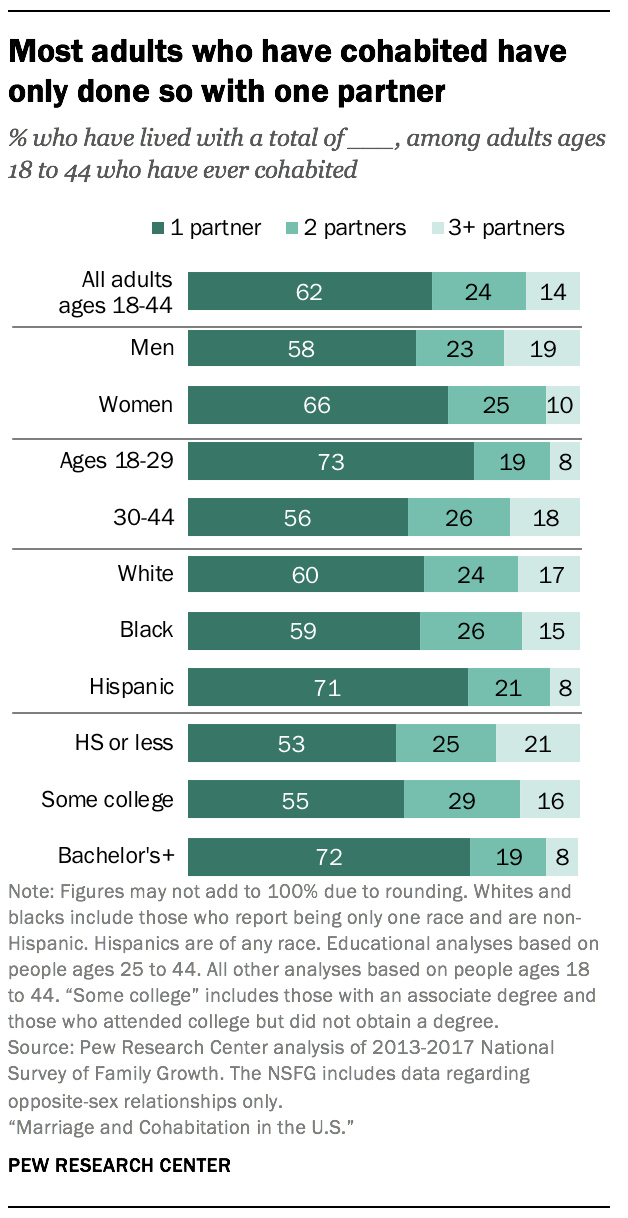
A majority (62%) of adults ages 18 to 44 who have ever cohabited have only ever lived with one partner. About one-in-four (24%) have had two cohabiting relationships over the course of their life and 14% have had three or more partners.
Those ages 18 to 29 who have ever cohabited are especially likely to have lived with only one partner in their life (73%), though a sizable minority (19%) have lived with two. Even among people ages 30 to 44 who have ever cohabited, a majority (56%) have had only one partner.
A relatively large share – 71% – of Hispanic cohabiters have lived with only one partner, and just 8% have lived with three or more. In contrast, about six-in-ten white and black cohabiters have only ever lived with one partner, and these groups are about twice as likely as their Hispanic counterparts to have had three or more partners.
There are gaps by education as well. While 72% of adults with a bachelor’s degree or higher who have ever cohabited have done so with only one partner, the same is true of only about half of those with less education.
More than half of cohabiting adults have children in the home
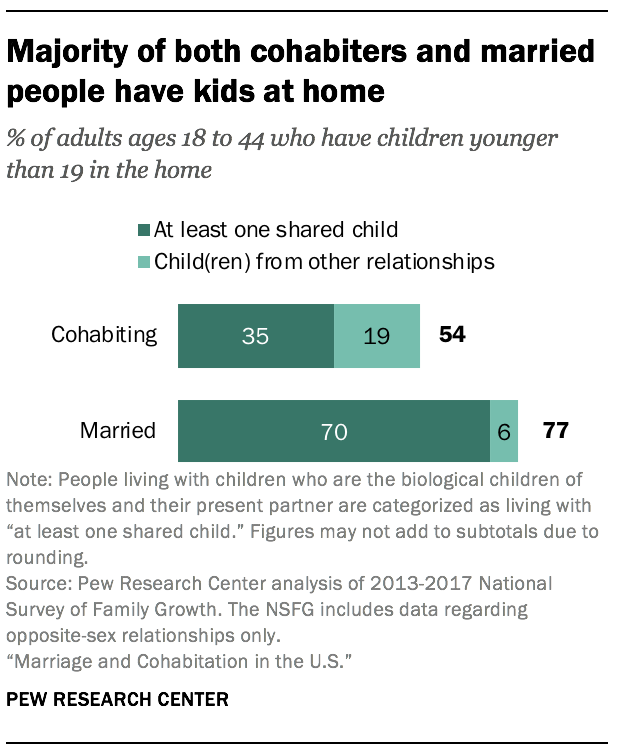
Most adults ages 18 to 44 who are presently living with a spouse or partner are also living with children. Among married adults, 77% have at least one child 18 or younger at home, while among cohabiters the share is 54%.
Married adults are twice as likely as cohabiters to be living with children they share biologically with their present spouse or partner – 70% of married adults live in this type of household, compared with 35% of cohabiters. Meanwhile, 19% of cohabiting adults are in families that include children from prior relationships only, as are 6% of married people.
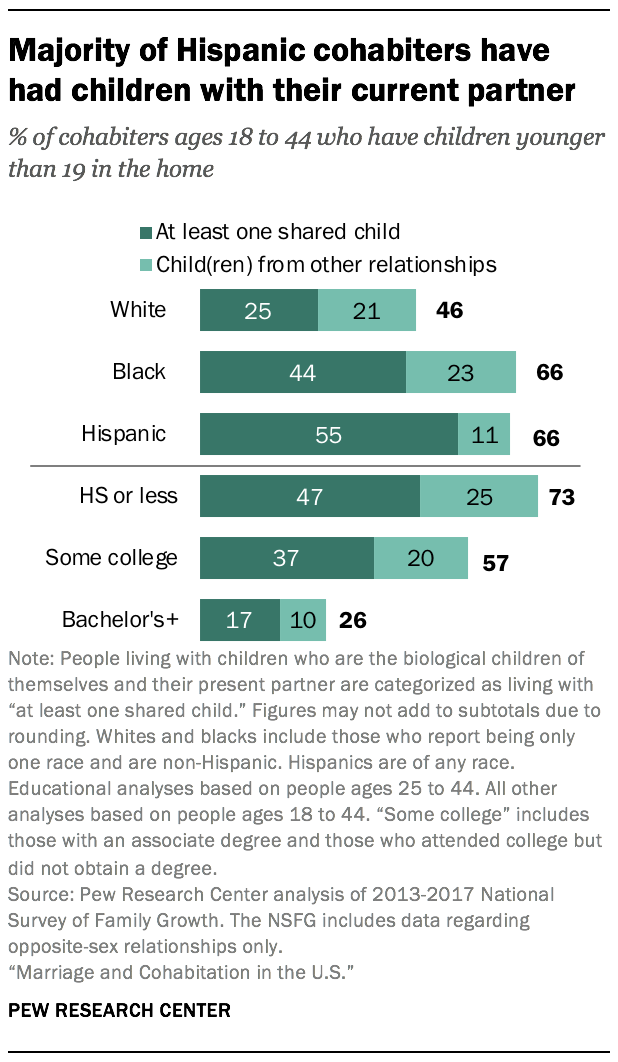
These patterns differ significantly by race and ethnicity. Two-thirds of Hispanic and black adults who are cohabiting are raising a child, compared with 46% of white cohabiters. Among Hispanic cohabiters, 55% are raising a child they share with their present partner. Smaller shares of black (44%) and white (25%) cohabiters are doing the same. (Among married people, there is little variation in the share living with a child: 77% for whites and blacks and 80% for Hispanics.)
The patterns also vary by educational attainment. Among cohabiters, 73% of those with a high school diploma or less education have a child in the home, compared with just 26% of those with a bachelor’s degree or more. This gap persists when looking at the proportion living with shared children: 47% of those with a high school diploma or less education live with a child they share with their current partner, compared with 17% of cohabiters with a bachelor’s degree or more. (Among married people, in comparison, the share with kids at home ranges from 83% among those with a high school diploma or less to 74% among those with a bachelor’s degree.)


