
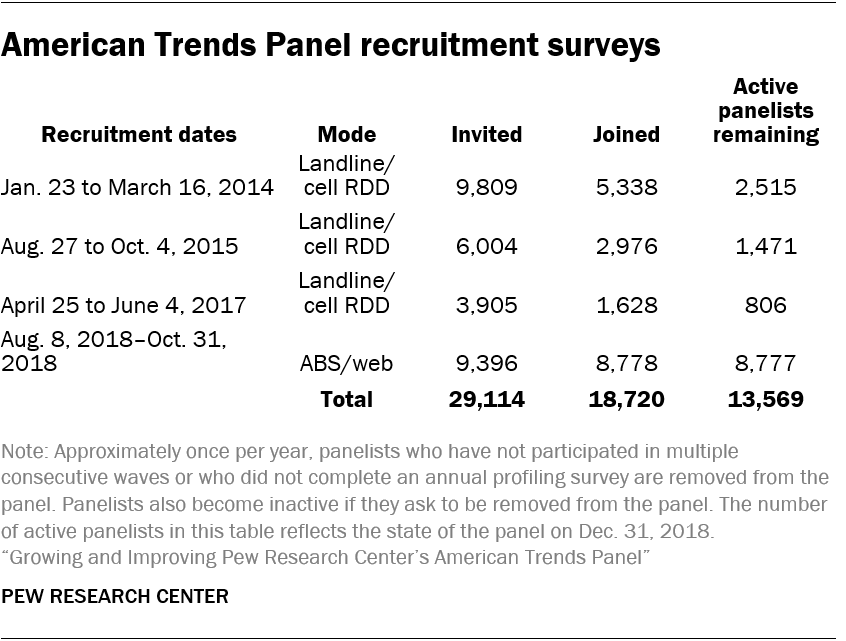
Pew Research Center’s American Trends Panel (ATP) is now the Center’s principal source of data for U.S. public opinion research. This nationally representative survey panel will turn 5 early this year. Since its creation in 2014, the panel has grown substantially and changed in many ways. The first cohort of recruited panelists consisted of 5,338 adults, of whom 4,266 took part in at least one survey. The average sample size of a typical wave for this cohort was just over 3,200. Following three more recruitments, the panel now has 13,569 active panelists with the most recent interview wave producing 10,618 online interviews.
This report provides a portrait of the panel as it now exists and describes how its methodology has evolved. It also discusses the ongoing challenges survey research is facing and how the American Trends Panel and other surveys are dealing with them.
Why a survey panel?
Try our email course on polling
Want to know more about polling? Take your knowledge to the next level with a short email mini-course from the Pew Research Center. Sign up now!
For several decades, most political and social surveys of the U.S. general public were conducted by telephone. In the vast majority of these, respondents were interviewed only once. But changing social and communications habits and the growth of privacy concerns have caused phone survey response rates to decline. Despite this, telephone surveys continue to provide accurate data, a point reinforced by the generally good performance of election polls conducted by phone in the 2018 midterm elections. That said, declining response rates and the shift from landlines to cellphones has led to dramatic increases in the cost of conducting high-quality telephone surveys.
While these changes were occurring, other trends were making self-administered surveys – and online surveys in particular – more appealing. Internet access was expanding, smartphone use was growing, and survey methodologists were demonstrating the measurement advantages of self-administration for surveys. The number of surveys conducted online boomed over the past two decades as businesses moved most of their market research to the web and academic users found the combination of low cost and ease of experimentation very appealing.
These trends led to a revival of interest in survey panels – a set of respondents who agree to take repeated interviews over time, thus reducing the need to sample, contact and persuade new respondents each time new data are needed. Panels are hardly a recent invention, but there has been a relatively recent growth in demand for high-quality online panels that use random samples. It was in this context that Pew Research Center decided to create the American Trends Panel in 2014.
Panels have many attractive characteristics when compared with survey designs that conduct only one interview with a sampled individual. Most notable is cost. Panels are expensive to build and properly maintain but, over time, yield interviews that are significantly cheaper than one-off surveys. Survey participation rates among active panelists are quite high (nearly 80%, on average, among ATP members), meaning that less effort is expended in obtaining a desired sample size. But the benefits of survey panels extend far beyond cost.
Because the same individuals are participating in multiple surveys over time, researchers can assemble a sizable amount of information about each person. Once a profile of each panelist’s attitudinal, social, demographic and political characteristics has been collected, subsequent surveys need not ask many of these questions again. This frees up questionnaire space for the more substantive questions of interest to researchers, as well as creates a rich and multidimensional portrait of each panelist. Because people tend to remain in panels for a long time (more than half of those who took part in an American Trends Panel survey in 2014 are still actively taking surveys four years later) it is possible to track individual-level change over time in behaviors and attitudes like opinions of the president.
Methods
The design of the American Trends Panel, like all surveys, involved numerous trade-offs. A popular joke in the survey research profession says that three things are valued above all: quality, speed and affordability. The punchline is that you can have any two of three that you want. The ATP is not immune to this problem.
It’s not quite as bad as that in practice, but the fact of trade-offs is real. Fast data collection often means sacrificing some representativeness in the sample. Hard-to-reach and hard-to-interview respondents can be located and persuaded to cooperate (thus improving the representativeness of the sample), but that’s often at considerable effort, time and cost. Resources devoted to reducing error in one aspect of a survey often means fewer resources can be devoted to some other aspect. Researchers at the Center constantly faced these issues as the ATP was built and as it has evolved.
The principal goal of the ATP was to provide a reliable, representative sample of adult Americans for the research needs of Pew Research Center. When it was created in 2014, it was seen as providing a supplement to the telephone surveys that were the core methodology being used for the Center’s U.S.-based political and social research. As telephone surveys have gotten more difficult and expensive to conduct, the panel has gradually become the primary data collection method for this research. It was the principal source of data for a majority of the Center’s reports about U.S. political and social attitudes and behavior in 2018. That transformation required that the panel grow in size, provide faster turnaround and improve its ability to represent the population accurately.
What follows is a description of the choices, decisions and results for each major aspect of building and operating the panel: recruitment, data collection, maintenance, weighting and costs.
Recruitment
Recruitment to the ATP has been conducted four times (2014, 2015, 2017 and 2018).1 Invitations to potential panelists for the first two recruitments were made at the end of large and lengthy random-digit-dial (RDD) telephone surveys that dealt primarily with political topics. In planning the third recruitment, researchers decided to use a shorter custom RDD telephone survey that had little political content because of concerns that using a survey focused on politics increased the likelihood that the panel would be biased toward people who are especially interested in politics.
For the most recent recruitment, researchers decided to abandon the telephone altogether and shift to an address-based sample (ABS) of households selected from the U.S. Postal Service’s Delivery Sequence File (DSF). A much higher share of those who responded to the mail-based recruitment survey agreed to join the panel than was the case for the three phone-based recruitments; 94% of those who completed the screening survey joined the panel, compared with about 50%, on average, from the three phone recruitments.
In addition, compared with the earlier panel cohorts, a much higher share of those who joined in the fourth recruitment have taken the regular surveys than was the case for those who joined after a phone recruitment. In the three telephone recruitments, a sizable share of those who agreed to join the panel never participated in a regular panel wave. By contrast, a far higher share of those in the fourth recruitment who agreed to join the panel have taken at least one of the available surveys.
The first three recruitments used dual-frame stratified RDD samples, with cellphone-to-landline ratios that were standard at Pew Research Center at the time of the data collection (50%-50% in 2014, 65%-35% in 2015 and 75%-25% in 2017).
For the 2018 ABS recruitment, the sample was designed to offset the somewhat lower response rates among Hispanics and African-Americans and to ensure adequate sample sizes of young adults. To achieve this goal, the sample was stratified using Census data and other information appended to the DSF, and households believed to belong to the targeted categories were sampled at a higher rate than others.
The mailings in the fourth recruitment included a letter of introduction inviting recipients (and specifically, the adult in the household with the next upcoming birthday) to take the online survey, information about how to take the survey, $2 in cash as a pre-incentive and a promise of a $10 post-incentive for completing the survey. At the end of the survey, respondents were invited to join the panel.
Recruiting non-internet households
There is an obvious obstacle to achieving a nationally representative sample with an online survey: not everyone in the U.S. uses the internet. The share of adults who do not use the internet was estimated to be 11% in 2018. And while this is a relatively small group, its members are quite different demographically from those who go online. Accordingly, it is important to represent them in the panel. In its first two years, the ATP did so by providing the non-internet respondents with a paper questionnaire that they could return by mail. This approach meant that both the online and mail respondents were using a self-administered survey (as opposed to interviewing the non-internet group by telephone). But this approach had serious drawbacks. Many of the advantages of online administration, such as the ability to use automatic skipping of questions and branching in the questionnaire (asking different questions of different respondents based on answers to previous questions), were impossible to replicate in the mail instrument. The mail questionnaire limited the number of different forms (or versions) of the questionnaire that could be employed. And producing a separate questionnaire and processing the mailings and returns required substantial administrative effort, as well as extending the time required to collect the data.
As a result of these issues, researchers made an effort in 2016 to convert the mail panelists to the web by supplying them with tablets, internet access and technical support. While two-thirds of the panelists taking surveys by mail at the time agreed to be converted to web, only 41% of the 574 actually followed through and began taking surveys on their tablets by the end of the year. A comparison of those who converted and those who did not showed – perhaps unsurprisingly – that age was a strong predictor of conversion. While half of those ages 50 to 64 (53%) converted, only 32% of those 65 and older did so. Education, sex, income and political engagement were not significant predictors of who would convert.
The third and fourth recruitments offered free tablets and internet service to all respondents who wanted to join the panel but lacked home internet access. A total of 125 tablet panelists were added in these recruitments, bringing the total number to 275, or 2% of all active panelists.
The underrepresentation of non-internet households remains a challenge for the ATP. Though they are a relatively small share of the adult population, these households are demographically quite different from those who do have home internet access. Nearly half of those in the panel without internet access are ages 65 and older, about six-in-ten have only a high school education or less and nearly half are nonwhite.
Interviewing
Panelists typically take at least one survey each month. The newly expanded panel makes it possible to conduct more than one survey per month by subsampling from the larger pool of panelists, but the volume of surveys may grow enough so that many panelists will be asked to complete two surveys in a month. This is still, by design, less frequent than many other probability-based panels in the U.S.
ATP panelists receive a survey invitation by email or text message if they have consented. Those who have been provided tablets are invited by text messages sent directly to their devices and are also sent a postcard informing them that a survey is ready. Panelists can access the survey online via the invitation. The survey is available to the panelist for approximately two weeks, and panelists can start the survey, pause, and return to it hours or days later if they choose.
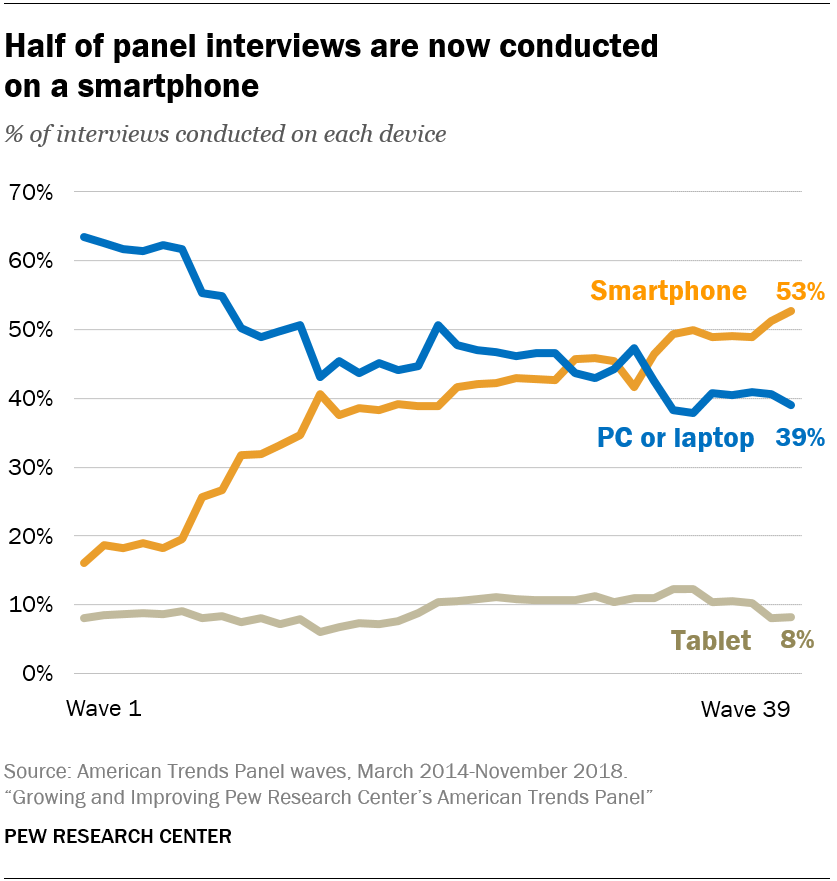
When the panel began, nearly two-thirds of respondents took their surveys on a PC or laptop. That share declined quickly through 2014 and 2015 and has continued to gradually decline since then. In a November 2018 wave of the panel, just over half of the interviews were conducted on a smartphone, while 39% used a PC or laptop. About 8% took the survey on a tablet computer, a figure that has remained fairly stable since the panel was created.
Sampling for panel waves
The vast majority of panel waves conducted between 2014 and 2018 invited all active panelists to participate. In a late 2018 wave, 78% of panelists invited to take the survey did so, which is similar to the median completion rate for the ATP. Now that the panel has more than 10,000 members, full-panel surveys will become less common. Most studies at Pew Research Center do not require such large sample sizes. Thus, one of the benefits of the large panel is the ability to conduct surveys more frequently by subsampling so that the same individuals are not asked to take part too frequently. Prospective panelists are told during the recruitment process that they will be asked to take surveys “about once or twice a month.”
Another benefit of subsampling is that samples can be tailored to be more representative of the public. As noted earlier, like most surveys, the panel has a disproportionately large number of certain kinds of people (e.g., college-educated individuals) and too few of others (e.g., young adults). Subsamples can be crafted to minimize these biases by undersampling certain groups and oversampling others. Doing so produces a sample that requires less aggressive weighting to align it with the population and, thus, a larger effective sample size. A recent subsampled wave produced an average design effect of 1.65, compared with typical design effects (at the time) of around 2.5 or higher for full sample waves.2
Weighting
A survey sample is a model of the population of interest. For the ATP, the population of interest is noninstitutionalized adults 18 and older living in the U.S. (50 states and the District of Columbia). Inevitably, survey samples will be imperfect models of the population. But they can be adjusted to better match the population through the process of weighting, which aligns characteristics of the sample to known population parameters.
Surveys like the ATP are typically weighted on demographic characteristics that are known to be associated with survey noncoverage and nonresponse or are related to important measures and concepts in the survey. They also are weighted to adjust for aspects of the sample design, such as the intentional oversampling or undersampling of certain kinds of individuals. The weighting of the ATP is very similar to that used in many types of U.S. political and social surveys but also has several unique elements that have been added to improve the accuracy of the data.
Base weighting
Since its inception, the ATP has been weighted in a multistep process that begins with a base weight incorporating the respondents’ recruitment survey selection probability and the fact that some respondents were subsampled for invitation to the panel (in 2014 and again in 2017). Components of the base weight included information about the telephone sampling frames (for the three cohorts recruited by phone) and any relevant subsampling. Between 2014 and 2017, a second step computed a propensity score to adjust for differential nonresponse to the invitation to join the panel. This step has been discontinued, both because it was judged to provide little if any additional bias correction and because the fourth recruitment did not employ a telephone survey. Details on how the propensity adjustment was computed can be found here.
Iterative proportional fitting, or “raking”
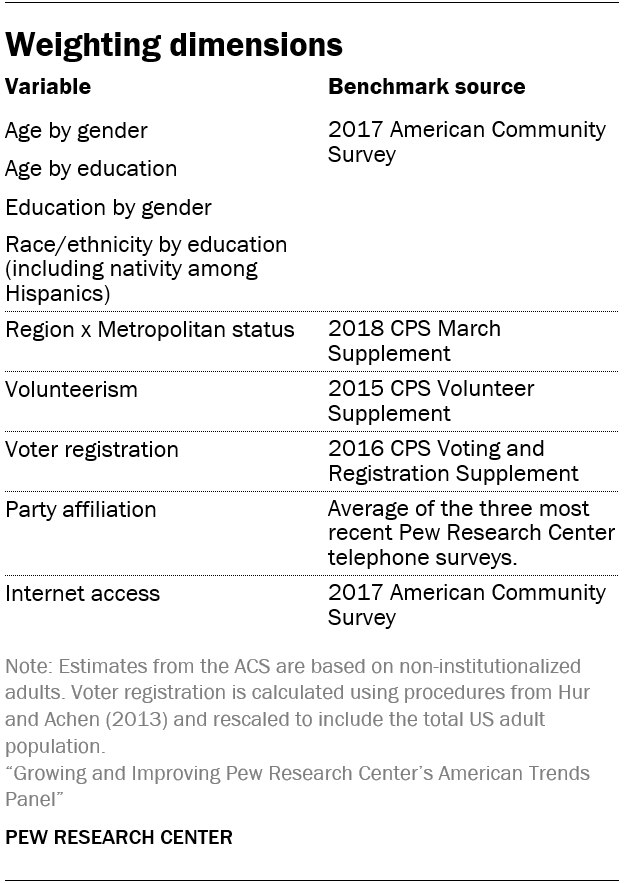
The final step in the weighting uses an iterative technique that aligns the sample to population benchmarks on a variety of characteristics. This stage of weighting, often referred to as “raking,” uses demographic characteristics that are reliably measured by the American Community Survey, including gender, age, education and race. Among Hispanics, the raking adjusts for place of birth (U.S. vs. elsewhere). Researchers have found that this helps correct for the underrepresentation of Hispanics who are immigrants. Two geographic variables used in the raking are U.S. Census region (four categories) and metropolitan status. The weighting also adjusts for internet access, using a measure from the American Community Survey. Party affiliation is also included in the raking to ensure proper representation of adults across the political spectrum. There is no official national parameter for party affiliation. Moreover, because it is an attitude rather than a demographic characteristic, it can change in response to political events. Accordingly, the target for party affiliation in the ATP is based on an average of the three most recent Pew Research Center telephone surveys that asked about party affiliation.
Correcting for the overrepresentation of civic and political engagement
Social and political surveys are known to overrepresent people who are politically engaged and who take part in volunteer activities. The American Trends Panel is no exception to this phenomenon. Because the panel is often used to study topics related to political and civic engagement, researchers decided to add volunteer activity as a raking variable in early 2016. A reliable national parameter is available because volunteering is measured regularly on the Current Population Survey’s Civic Engagement Supplement. Previous research by Pew Research Center showed that correcting for the bias in volunteer activity has almost no effect on measures of public opinion but does reduce reported levels of social activity and community involvement such as talking with neighbors or attending religious services.
Bias in political engagement is somewhat more complicated. While adding volunteering to the weighting helps to reduce the overrepresentation of the politically engaged, it does not eliminate the bias completely. A first step at addressing this was taken in 2017 with the third recruitment to the ATP. Rather than appending the recruitment to a survey focused mostly on politics (as the first two recruitments did), a dedicated recruitment survey with relatively little political content (and considerably fewer questions) was used.
This change resulted in a recruitment cohort that was approximately 10 percentage points less likely to be registered to vote than the first two cohorts. But the share who are registered remained somewhat higher than the true population value. Researchers decided to add voter registration to the raking, starting with the first wave after the summer 2018 refreshment was completed (November 2018). The parameter for this variable was taken from the 2016 Current Population Survey Voting and Registration Supplement, adjusted for actual turnout as described by Hur and Achen (2013) and implemented by Michael McDonald.
Who’s in the panel?
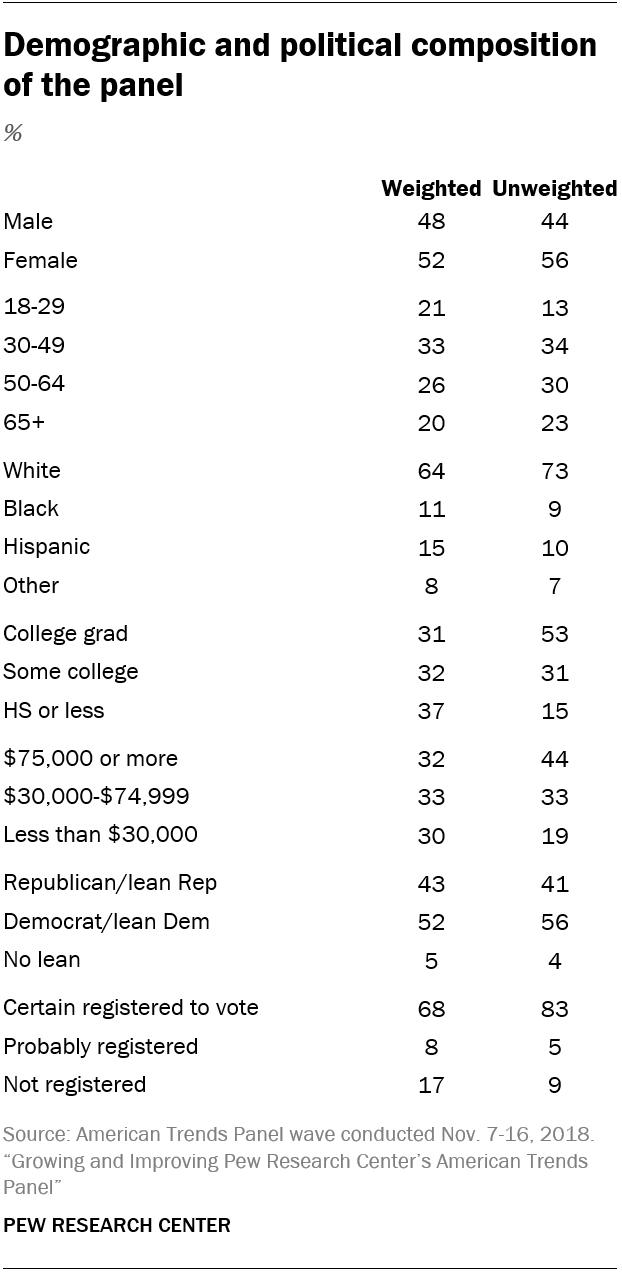
The panel contains a broad cross-section of the U.S. adult population. Fully one-quarter of panelists are nonwhite, one-in-five have family incomes below $30,000 and nearly half are under the age of 50. But the sample reflects shortcomings that are typical of public opinion surveys. Nonwhites, people under 30, Spanish-speaking Hispanics and people with only a high school education or less are underrepresented, while registered voters, non-Hispanic whites and college graduates are overrepresented. Higher incentives to young people, minorities, the less-educated and the politically disengaged help to keep these harder-to-survey groups participating but does not completely solve the problem. Weighting (discussed above) addresses the demographic imbalances in the sample for variables that are used in the weighting and mitigates the bias in many other variables such as attendance at religious services and interest in politics.
Costs
While the exact cost of Pew Research Center’s surveys is confidential, it is possible to describe the relative costs of various data collection methods. The American Trends Panel required a large initial investment to create its management and data infrastructure. The four recruitments conducted since early 2014 were also expensive, though the first two took advantage of some cost savings since the recruitment request was appended to the end of a telephone survey that was funded for a different purpose. The third and fourth recruitments were conducted primarily for recruitment to the panel. Collectively, the recruitment costs are a part of what might be described as the total cost of ownership of the panel. Adding to the overall cost is the migration of mail mode panelists to tablet computers in 2016 and the cost of providing tablets to new recruits in 2017 and 2018.
Conducting each wave of the panel incurs additional vendor costs in management, programming, data collection, respondent incentives and data processing. There are also expenses associated with the ongoing management and maintenance of the panel, including keeping track of panelists as they move, responding to questions and inquiries from panelists, paying the cellular plan costs for the panelists who were provided a tablet and providing technical support to these panelists.
Considering the full costs of panel creation, recruitment, management and maintenance, plus survey-specific expenses, a 15-minute panel interview is considerably less expensive than a dual-frame RDD interview with the same substantive content. Even with the survey-specific and ongoing management and maintenance expenses, interviewing a large panel sample online is inherently less costly than either a telephone survey (because of the cost of interviewing) or a one-time online survey (because the full costs of sampling and contacting potential respondents is incurred). Over time, panel interviews become less expensive as the sunk costs are spread across a larger number of interviews. The longer a panel member is in a panel, the less expensive they become on cost-per-complete basis.
Contractors
Pew Research Center works with Ipsos, an international market and opinion research organization, to recruit panelists, manage the panel and conduct the surveys. Ipsos also manages KnowledgePanel, a very large probability-based online panel similar to the American Trends Panel. Ipsos is the third contractor to work with Pew Research Center on the project. Abt Associates assisted Pew Research Center in designing and building the panel in 2014. They managed the panel until December 2017, when GfK was hired to do this work. GfK’s custom research business was acquired by Ipsos in October 2018. All of the GfK key staff working on the ATP remained in their same roles at Ipsos.
