Commercial voter files have been used in a wide variety of ways, either by themselves or in conjunction with other data. Although such files have been employed by political campaigns for many years, their use by journalists and others interested in elections has increased recently as familiarity with the files has grown and the ancillary data available on the files has expanded.
Perhaps the most widespread use of the voter files is to help political practitioners more effectively and efficiently engage with potential voters. Political campaigns make use of the files to identify potential supporters and to communicate with them, either to influence their candidate choice, mobilize them to turn out to vote, or both. Groups organized around specific issues such as gun rights or access to abortion use the files in similar ways.
Pollsters increasingly use voter files to draw samples for their surveys. Voter files have long been used for sampling by pollsters working for political campaigns, but their use is growing among public and media pollsters as well, as evidenced in the November 2017 statewide elections in Virginia, where a majority of publicly released polls relied on voter file samples. Sampling from voter files is a more efficient way of reaching likely voters than other sampling methods such as random-digit dialing (RDD), though the fact that phone numbers are not available for everyone on the voter file can introduce errors. And information about past voting available on the files is useful in helping pollsters make more accurate predictions about who is likely to turn out in an upcoming election. Although the files have not been widely used as sampling sources for general public surveys, it is possible that they could be in the future if coverage of the unregistered population improves.
A third use of voter files is by journalists, academics and other election analysts who employ the files to answer specific questions about voters and elections. These include the demographic composition of the electorate, what kinds of voters tend to vote early or by absentee ballot, who votes in primary elections and what kinds of people are habitual vs. episodic voters. This chapter takes a closer look at several of these applications of voter files for improving our understanding of political attitudes and behaviors.
Voter files as sampling frames for surveys and experiments
Political campaigns have long used voter files as sampling frames for their election-related polling, but public pollsters have recently begun to adopt them as well. Of the nine pollsters that released surveys conducted in the final nine days before the 2017 Virginia gubernatorial election and made their sample source public, seven used a voter file and only two used RDD.
Voter files were also the predominant source of telephone samples for state-level public polling in the 2016 presidential election. The Ad Hoc Committee on 2016 Election Polling, created by the American Association for Public Opinion Research (AAPOR), compiled a database of 206 statewide pre-election polls completed within the last 13 days before the election. The source of the sample (whether RDD, voter file or internet) was coded. Of 206 state polls in the database, 62% were based on telephone interviews or a hybrid of telephone and online. Of these phone polls, 80% used a voter file as a sample source.
Voter files are attractive as sources of samples because they provide good coverage of the population of interest (registered voters in the case of election polling) while largely excluding individuals who are not eligible to vote. Since most campaign polling occurs within defined geographies such as a state or a legislative district, voter files make targeting the voters of interest much more efficient than is the case with RDD, especially now that cellphones constitute large shares of the typical RDD sample and cellphone area codes and exchanges are not reliable indicators of where a person actually resides.
Another important benefit of using voter files for sampling is that they contain information about past voting behavior as well as partisan registration or estimates of party affiliation. This information permits a pollster to better target likely voters by including more individuals in the sample who have a proven history of voting in elections similar those of interest to a pollster. Similarly, the inclusion of measures of modeled party identification helps pollsters to draw samples that reflect the population of interest, whether it is all registered voters or those who have a high propensity for voting.
One of the downsides of using voter files for telephone polls is that telephone numbers are not available for everyone on the voter file. Among members of the American Trends Panel matched to the commercial voter files in this study, the percentage of matched cases for which a phone number is available from the vendor varied between 55% and 91%. Older adults are more likely than others to have a phone number on a given file, though the availability of numbers did not vary as much across other demographic variables.
Political scientists and political practitioners alike have made extensive use of voter files for selecting and assigning research subjects in experiments. One recent academic publication describes an ambitious field experiment by David E. Broockman and Daniel M. Butler that enlisted state legislators to help test the impact of different messages in official communications with constituents. Legislators who agreed to cooperate with the study allowed the researchers to vary the issue-related content of mailings to voters in their districts, who were selected from a commercial voter file and randomly assigned to different experimental conditions. Using surveys conducted before and after sending the mailings, the researchers found that “legislators can shape constituents’ views on issues by merely staking out their positions. The constituents who received letters containing legislators’ positions were significantly more likely to subsequently share their legislators’ view.”
Describing the electorate
On June 9, 2016, The New York Times published an analysis by Nate Cohn that argued that “millions more white, older working class voters went to the polls in 2012 than was found by exit polls on Election Day.” This finding led Cohn to a somewhat surprising conclusion about Donald Trump’s electoral prospects, given Hillary Clinton’s consistent lead in national polls at the time: “There’s more room for him to make gains among white working-class voters than many assumed — enough to win without making gains among nonwhite or college-educated white voters.” In fact, Cohn’s analysis described how Trump was able to find a narrow path to victory on the support of non-college white voters in key states.
The New York Times analysis was based on a combination of data from surveys conducted by the U.S. Census and from Catalist, a commercial national voter file. The key datum of interest was the share of voters who were older non-college whites: “Over all, the exit polls suggest that 23 percent of voters in 2012 were white, over age 45 and without a college degree. Catalist puts this group at 29 percent, and the census at 30 percent — implying 10 million more voters than the 23 percent figure.”
According to Cohn, if there were this many additional older, non-college white voters, President Obama must have done better with this group than is generally assumed, especially outside the South. The implication is that these voters were potentially available to Trump, who was making explicit appeals to them. Post-election analysis of polling data by The New York Times suggests that Trump was able to capture enough white 2012 Obama voters to win in the critical states of Wisconsin, Michigan and Pennsylvania.
Identifying the political affiliation of … just about anyone
Commercial voter files can be used to describe political engagement and affiliation among almost any group of individuals, as long as their names and locations are publicly available. Political scientist Eitan Hersh and his colleagues have used voter files to describe the political characteristics of professionals such as physicians, members of the clergy and even married couples. For the clergy study, Hersh and his colleague Gabrielle Malina compiled a database of 186,000 Christian and Jewish clergy from websites of congregations across the U.S., of whom 130,000 could be matched to a commercial voter file. With this linkage, they were able to characterize the partisan composition and voter turnout patterns of clergy in different denominations. With ancillary information on the voter files, they could further describe patterns of political affiliation and engagement among clergy by demographic characteristics. Reform Judaism rabbis were the most Democratic, while pastors in Wisconsin Lutheran congregations were the most Republican.
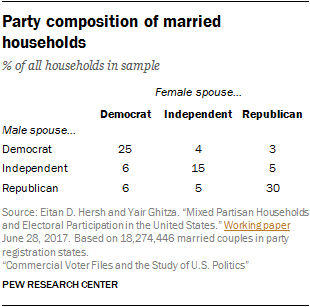
Hersh’s study of married couples (conducted with Yair Ghitza of Catalist, a voter file vendor) found that about one-in-ten households with a married couple included one Democratic and one Republican spouse. Many other households had a Republican or a Democrat married to an independent, and 15% featured two independents. Overall, about 55% had partisans (Democratic or Republican) who were married to someone of the same party. Among other insights in the study was the fact that voter turnout tended to be higher among partisans who were married to someone of the same party than partisans married to an independent or someone of the opposite party.
These kinds of applications come with the standard caveats that apply to all voter file work – matching people to the files is an inexact science, the data on the files are not perfect – but they do provide a perspective on certain populations that would be expensive or perhaps impossible to obtain through conventional surveys.
Using voter files to identify ‘consistent voters,’ ‘drop-off voters’ and ‘nonvoters’
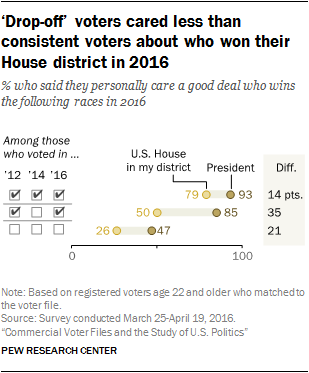
Voter turnout in the U.S. varies considerably by the type of election. It is highest in presidential election years and drops off considerably in off-years. Not only does overall turnout vary but the kinds of people who vote only in presidential elections are different from those who vote in both the presidential and the off-year elections. And, of course, some people rarely or never vote at all.
Pew Research Center explored the differences between these three kinds of voters: “consistent voters” – those who vote in both presidential and off-year elections, “drop-off voters” – those who vote in presidential but not off-year elections and “nonvoters” – those who rarely or never vote. The Center could have classified voters based on self-reported turnout in previous elections, but considerable research has shown that people tend to overreport their past voting. Accordingly, survey respondents from a sizable survey conducted using GfK’s KnowledgePanel (a probability-based panel of U.S. adults who have agreed to take periodic surveys) were matched with turnout records in the national voter file compiled by TargetSmart, a commercial voter file vendor. Nearly nine-in-ten respondents (88%) were matched to a record in the TargetSmart database. Voters were classified based on whether they voted in 2012, 2014 and 2016 (consistent voters), 2012 and 2016 but not 2014 (drop-off voters) or none of the three elections (nonvoters). These three kinds of voters were compared on a wide range of demographic and political characteristics, including attitudes about citizenship, politics and the role of government.
Matching a telephone survey to a voter file
The core analysis in this report is based on linking members of the American Trends Panel with their corresponding voter registration and turnout data found in commercial voter files. This linkage is easier and more reliable for survey panels, which typically have names, addresses and other information that is useful for matching. But other kinds of surveys – such as RDD telephone surveys – may also be matched to commercial voter files, even if it is not feasible to gather all of the necessary personal information for precise matching. Matching by phone is possible because most records in the commercial voter files have telephone numbers associated with them. For example, File 2 reported to us that it has phone numbers for 72% of registered adults and 55% of unregistered adults. But how well does matching by phone number alone work in practice?
To test the feasibility of linking an RDD sample to a voter file, researchers matched records from an August 2016 dual-frame RDD telephone survey to a commercial voter file vendor. Portions of the matched data (which included voter file records associated with telephone numbers from both survey respondents and nonrespondents) were employed in an analysis of possible nonresponse bias in Pew Research Center’s 2017 study of survey nonresponse.
Of 40,182 phone numbers dialed, 16,466 (41%) were matched to one or more voter records. Among the 2,802 completed interviews, 1,513 (54%) were matched to at least one voter record. Many numbers were matched to more than one voter record. Especially in the landline sample, it was evident that two or more members of the same household were associated with the same number; many of these shared the same last name and the same address. Similarly, some individuals had two or three voter records (usually from different states or locations within a state).
Center researchers attempted to select the voter record that best corresponded with the actual survey respondent and was the most up-to-date. Respondents who matched the voter record with respect to sex and age (within plus or minus two years) were retained for further examination, along with those for whom age was not available from either the survey or the voter file. The respondents’ first names (collected at the end of the survey for many of the respondents) and ZIP code were used to further narrow the matched cases.
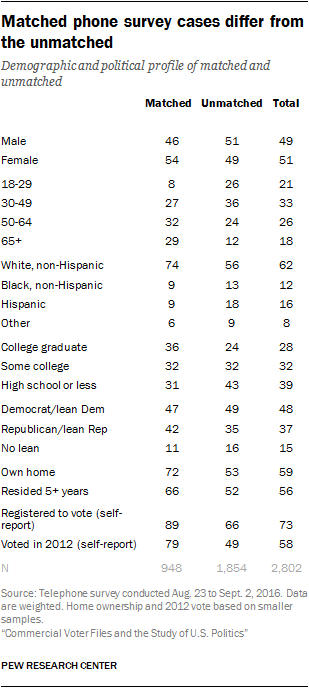
In all, 948 respondents in the poll (34% unweighted, 30% weighted) were matched to a voter record that corresponded with the survey record on sex, age, race (white vs. nonwhite) and location. The unweighted match rate was 67% among landline numbers and 23% among cellphone numbers. This match rate yields a sizable number of survey respondents with official voting records and modeled data on partisanship, political engagement and other variables. Still, the kinds of respondents who could be matched differed somewhat from those for whom a reliable match could not be made. The pattern of differences is very similar to that seen in the analysis of matching using the American Trends Panel, though the magnitude of the differences is greater. As we would expect, respondents who say they are not registered to vote were far less likely than others to be matched, though some were. And younger, less educated, less affluent, minority and politically unengaged individuals (based on survey responses) were considerably less likely to be matched.
Consequently, the trade-offs described earlier in this report are very evident here. The composition of the matched group is different from the unmatched group. Demographically, the matched respondents are older (29% ages 65 and older compared with just 12% among the unmatched), better educated, more likely to be non-Hispanic white and to own their home. Politically, the matched group is much more engaged and much more likely to be Republican than the unmatched group.
The utility of a process that matches about one-third of a telephone survey sample may be limited for researchers who are working with small sample sizes. But if the survey had attempted to collect name and address for the respondents, it’s possible that additional matches could have been located.
