Our equivalent of a crystal ball – the voter file, combined with a post-election survey interview – provides us with a validated record of turnout for our survey respondents. Our post-election survey provides us with the respondents’ report of how they voted. This allows us to see how a Democratic advantage among registered voters in a survey conducted the September before the elections turned into a Republican win among those verified to have turned out to vote.
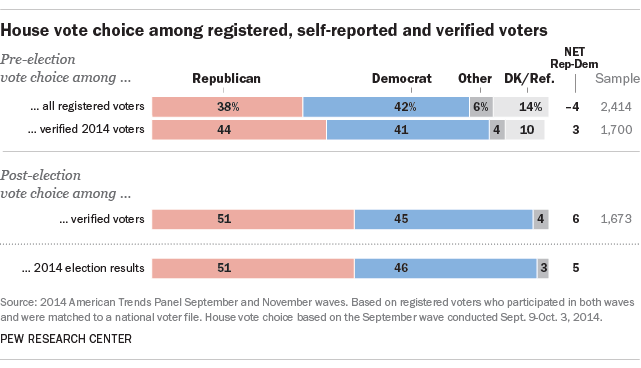
Of the three main reasons why election polls sometimes do not match the election results, we can rule out the first one, which is bias in the survey’s sample. Among verified voters interviewed in the post-election survey, 51% reported voting Republican, 45% Democratic, almost exactly matching the outcome of the elections. This shows that the sample is not biased with respect to preferences in the elections for U.S. House.

The real answer for why the outcome differed from the pre-election estimate: Some people changed their minds, while others did not show up to vote. In 2014, at least, Republicans benefited from both of these factors: People who had thought of voting for a third-party candidate or were undecided were more likely to shift toward the GOP, and those who ended up not voting disproportionately favored Democratic candidates.
In the September pre-election survey, 42% of registered voters favored a Democratic House candidate, while 38% favored a Republican, a 4 percentage point Democratic advantage.3 If we could have used the perfect knowledge of hindsight, however, and only selected those who would eventually be verified as having actually turned out to vote, that same September survey would have found that Republican candidates held a 3-point lead at the time (44% vs. 41%). Given that the final GOP advantage among all tallied votes for the House of Representatives was nearly 6 points (51.4% vs. 45.7%),4 the data suggest that correctly predicting who would turn out to vote would have produced a more accurate forecast, even when relying on candidate choices among voters more than one month prior to the elections.

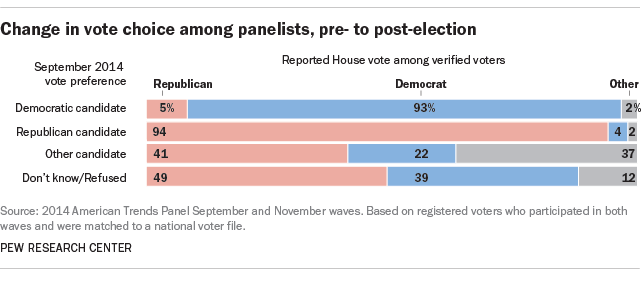
Since we interviewed these voters again after the elections, we can also tell whether they changed their minds in ways that affected the overall outcome. The vast majority of those supporting either a Republican or a Democrat in the pre-election poll remained loyal to their candidate (94% among Republicans, 93% among Democrats). But among the small number of voters supporting a third-party candidate or who had no preference in the pre-election waves, Republicans picked up more support than did the Democrats.
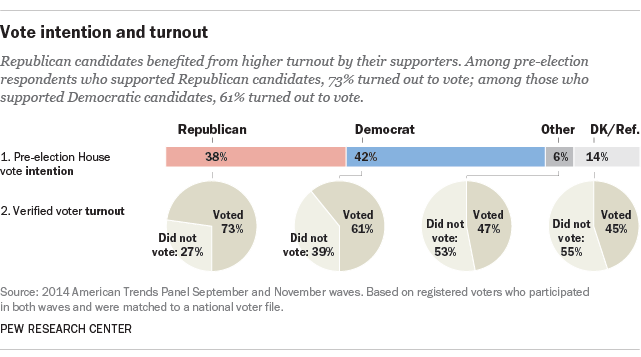
While changed minds contributed to some of the difference between the September poll result and the final outcome, this factor was less important than the turnout differential between Republicans and Democrats. Fully 73% of pre-election registered voters who supported a Republican candidate in the pre-election survey ultimately turned out to vote on Election Day, based on verified vote from the voter file. By comparison, only 61% of registered voters who supported a Democratic candidate were verified to have voted.

As noted earlier, simply accurately identifying who would actually turn out to vote – without accounting for shifts in voter choices – would have shown the Republicans to be leading by about 3 percentage points in the pre-election survey, an improvement over the tally among all registered voters at the time (Republicans trailing by 4 points). On top of this, the GOP picked up an additional 2 points on the margin as a result of changing preferences from pre- to post-election.
In the next section, we examine a variety of approaches to distinguishing likely voters from nonvoters.