Pew Research Center has conducted many surveys about abortion over the years, providing a lens into Americans’ views on whether the procedure should be legal, among a host of other questions.
In a Center survey conducted nearly a year after the Supreme Court’s June 2022 decision that ended the constitutional right to abortion, 62% of U.S. adults said the practice should be legal in all or most cases, while 36% said it should be illegal in all or most cases. Another survey conducted a few months before the decision showed that relatively few Americans take an absolutist view on the issue.
Find answers to common questions about abortion in America, based on data from the Centers for Disease Control and Prevention (CDC) and the Guttmacher Institute, which have tracked these patterns for several decades:
- How many abortions are there in the U.S. each year?
- How has the number of abortions in the U.S. changed over time?
- What is the abortion rate among women in the U.S.? How has it changed over time?
- What are the most common types of abortion?
- How many abortion providers are there in the U.S., and how has that number changed?
- What percentage of abortions are for women who live in a different state from the abortion provider?
- What are the demographics of women who have had abortions?
- When during pregnancy do most abortions occur?
- How often are there medical complications from abortion?
This compilation of data on abortion in the United States draws mainly from two sources: the Centers for Disease Control and Prevention (CDC) and the Guttmacher Institute, both of which have regularly compiled national abortion data for approximately half a century, and which collect their data in different ways.
The CDC data that is highlighted in this post comes from the agency’s “abortion surveillance” reports, which have been published annually since 1974 (and which have included data from 1969). Its figures from 1973 through 1996 include data from all 50 states, the District of Columbia and New York City – 52 “reporting areas” in all. Since 1997, the CDC’s totals have lacked data from some states (most notably California) for the years that those states did not report data to the agency. The four reporting areas that did not submit data to the CDC in 2021 – California, Maryland, New Hampshire and New Jersey – accounted for approximately 25% of all legal induced abortions in the U.S. in 2020, according to Guttmacher’s data. Most states, though, do have data in the reports, and the figures for the vast majority of them came from each state’s central health agency, while for some states, the figures came from hospitals and other medical facilities.
Discussion of CDC abortion data involving women’s state of residence, marital status, race, ethnicity, age, abortion history and the number of previous live births excludes the low share of abortions where that information was not supplied. Read the methodology for the CDC’s latest abortion surveillance report, which includes data from 2021, for more details. Previous reports can be found at stacks.cdc.gov by entering “abortion surveillance” into the search box.
For the numbers of deaths caused by induced abortions in 1963 and 1965, this analysis looks at reports by the then-U.S. Department of Health, Education and Welfare, a precursor to the Department of Health and Human Services. In computing those figures, we excluded abortions listed in the report under the categories “spontaneous or unspecified” or as “other.” (“Spontaneous abortion” is another way of referring to miscarriages.)
Guttmacher data in this post comes from national surveys of abortion providers that Guttmacher has conducted 19 times since 1973. Guttmacher compiles its figures after contacting every known provider of abortions – clinics, hospitals and physicians’ offices – in the country. It uses questionnaires and health department data, and it provides estimates for abortion providers that don’t respond to its inquiries. (In 2020, the last year for which it has released data on the number of abortions in the U.S., it used estimates for 12% of abortions.) For most of the 2000s, Guttmacher has conducted these national surveys every three years, each time getting abortion data for the prior two years. For each interim year, Guttmacher has calculated estimates based on trends from its own figures and from other data.
The latest full summary of Guttmacher data came in the institute’s report titled “Abortion Incidence and Service Availability in the United States, 2020.” It includes figures for 2020 and 2019 and estimates for 2018. The report includes a methods section.
In addition, this post uses data from StatPearls, an online health care resource, on complications from abortion.
How many abortions are there in the U.S. each year?
An exact answer is hard to come by. The CDC and the Guttmacher Institute have each tried to measure this for around half a century, but they use different methods and publish different figures.
The last year for which the CDC reported a yearly national total for abortions is 2021. It found there were 625,978 abortions in the District of Columbia and the 46 states with available data that year, up from 597,355 in those states and D.C. in 2020. The corresponding figure for 2019 was 607,720.
The last year for which Guttmacher reported a yearly national total was 2020. It said there were 930,160 abortions that year in all 50 states and the District of Columbia, compared with 916,460 in 2019.
- How the CDC gets its data: It compiles figures that are voluntarily reported by states’ central health agencies, including separate figures for New York City and the District of Columbia. Its latest totals do not include figures from California, Maryland, New Hampshire or New Jersey, which did not report data to the CDC. (Read the methodology from the latest CDC report.)
- How Guttmacher gets its data: It compiles its figures after contacting every known abortion provider – clinics, hospitals and physicians’ offices – in the country. It uses questionnaires and health department data, then provides estimates for abortion providers that don’t respond. Guttmacher’s figures are higher than the CDC’s in part because they include data (and in some instances, estimates) from all 50 states. (Read the institute’s latest full report and methodology.)
While the Guttmacher Institute supports abortion rights, its empirical data on abortions in the U.S. has been widely cited by groups and publications across the political spectrum, including by a number of those that disagree with its positions.
These estimates from Guttmacher and the CDC are results of multiyear efforts to collect data on abortion across the U.S. Last year, Guttmacher also began publishing less precise estimates every few months, based on a much smaller sample of providers.
The figures reported by these organizations include only legal induced abortions conducted by clinics, hospitals or physicians’ offices, or those that make use of abortion pills dispensed from certified facilities such as clinics or physicians’ offices. They do not account for the use of abortion pills that were obtained outside of clinical settings.
How has the number of abortions in the U.S. changed over time?
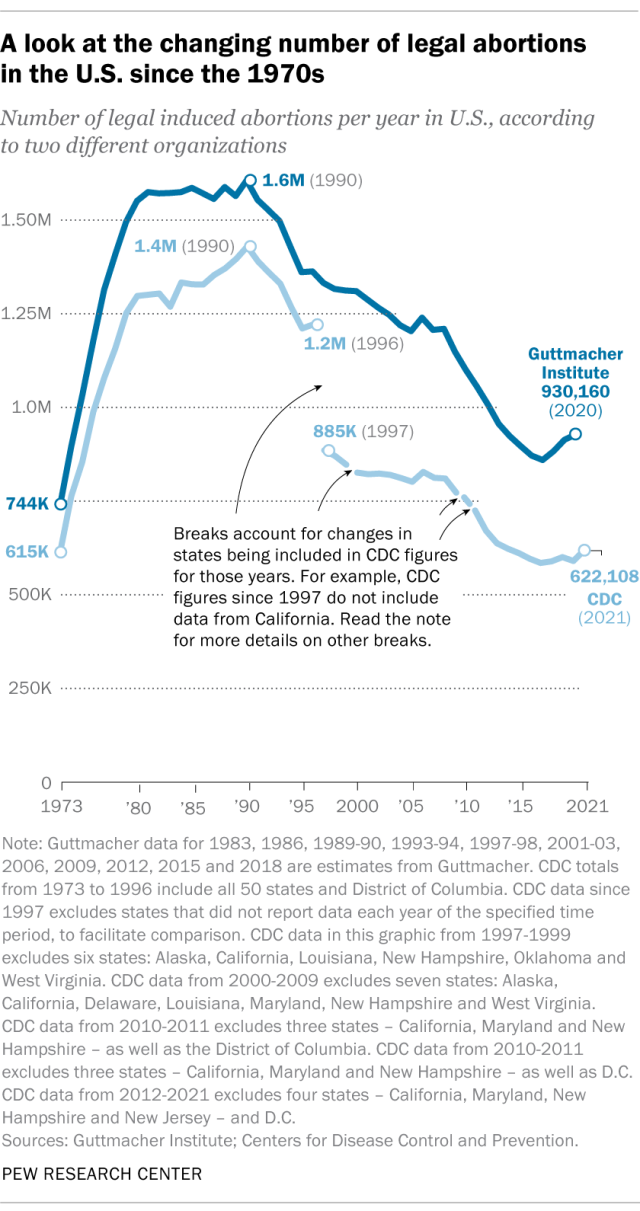
The annual number of U.S. abortions rose for years after Roe v. Wade legalized the procedure in 1973, reaching its highest levels around the late 1980s and early 1990s, according to both the CDC and Guttmacher. Since then, abortions have generally decreased at what a CDC analysis called “a slow yet steady pace.”
Guttmacher says the number of abortions occurring in the U.S. in 2020 was 40% lower than it was in 1991. According to the CDC, the number was 36% lower in 2021 than in 1991, looking just at the District of Columbia and the 46 states that reported both of those years.
(The corresponding line graph shows the long-term trend in the number of legal abortions reported by both organizations. To allow for consistent comparisons over time, the CDC figures in the chart have been adjusted to ensure that the same states are counted from one year to the next. Using that approach, the CDC figure for 2021 is 622,108 legal abortions.)
There have been occasional breaks in this long-term pattern of decline – during the middle of the first decade of the 2000s, and then again in the late 2010s. The CDC reported modest 1% and 2% increases in abortions in 2018 and 2019, and then, after a 2% decrease in 2020, a 5% increase in 2021. Guttmacher reported an 8% increase over the three-year period from 2017 to 2020.
As noted above, these figures do not include abortions that use pills obtained outside of clinical settings.
What is the abortion rate among women in the U.S.? How has it changed over time?
Guttmacher says that in 2020 there were 14.4 abortions in the U.S. per 1,000 women ages 15 to 44. Its data shows that the rate of abortions among women has generally been declining in the U.S. since 1981, when it reported there were 29.3 abortions per 1,000 women in that age range.
The CDC says that in 2021, there were 11.6 abortions in the U.S. per 1,000 women ages 15 to 44. (That figure excludes data from California, the District of Columbia, Maryland, New Hampshire and New Jersey.) Like Guttmacher’s data, the CDC’s figures also suggest a general decline in the abortion rate over time. In 1980, when the CDC reported on all 50 states and D.C., it said there were 25 abortions per 1,000 women ages 15 to 44.
That said, both Guttmacher and the CDC say there were slight increases in the rate of abortions during the late 2010s and early 2020s. Guttmacher says the abortion rate per 1,000 women ages 15 to 44 rose from 13.5 in 2017 to 14.4 in 2020. The CDC says it rose from 11.2 per 1,000 in 2017 to 11.4 in 2019, before falling back to 11.1 in 2020 and then rising again to 11.6 in 2021. (The CDC’s figures for those years exclude data from California, D.C., Maryland, New Hampshire and New Jersey.)
What are the most common types of abortion?
The CDC broadly divides abortions into two categories: surgical abortions and medication abortions, which involve pills. Since the Food and Drug Administration first approved abortion pills in 2000, their use has increased over time as a share of abortions nationally, according to both the CDC and Guttmacher.
The majority of abortions in the U.S. now involve pills, according to both the CDC and Guttmacher. The CDC says 56% of U.S. abortions in 2021 involved pills, up from 53% in 2020 and 44% in 2019. Its figures for 2021 include the District of Columbia and 44 states that provided this data; its figures for 2020 include D.C. and 44 states (though not all of the same states as in 2021), and its figures for 2019 include D.C. and 45 states.
Guttmacher, which measures this every three years, says 53% of U.S. abortions involved pills in 2020, up from 39% in 2017.
Two pills commonly used together for medication abortions are mifepristone, which, taken first, blocks hormones that support a pregnancy, and misoprostol, which then causes the uterus to empty. According to the FDA, medication abortions are safe until 10 weeks into pregnancy.
Surgical abortions conducted during the first trimester of pregnancy typically use a suction process, while the relatively few surgical abortions that occur during the second trimester of a pregnancy typically use a process called dilation and evacuation, according to the UCLA School of Medicine.
How many abortion providers are there in the U.S., and how has that number changed?
In 2020, there were 1,603 facilities in the U.S. that provided abortions, according to Guttmacher. This included 807 clinics, 530 hospitals and 266 physicians’ offices.
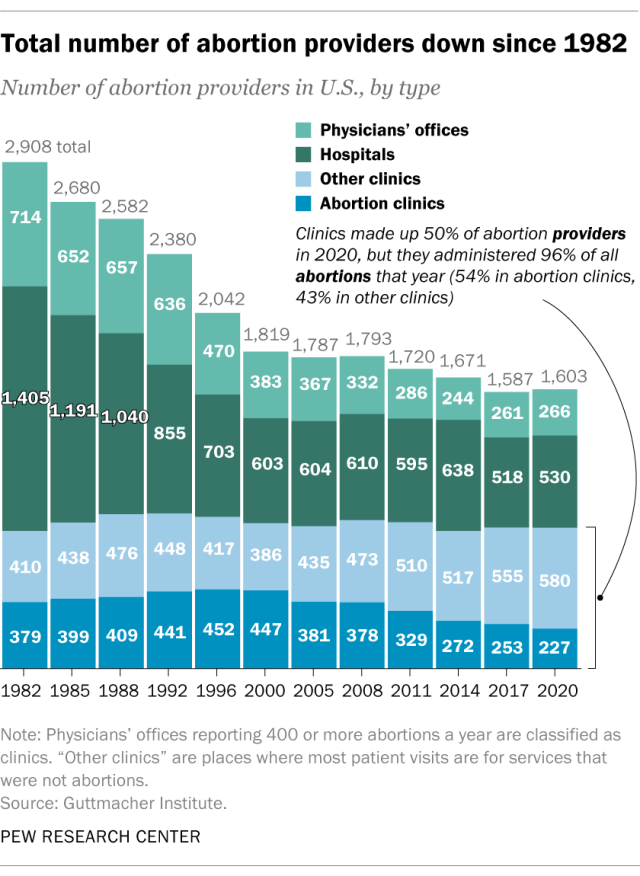
While clinics make up half of the facilities that provide abortions, they are the sites where the vast majority (96%) of abortions are administered, either through procedures or the distribution of pills, according to Guttmacher’s 2020 data. (This includes 54% of abortions that are administered at specialized abortion clinics and 43% at nonspecialized clinics.) Hospitals made up 33% of the facilities that provided abortions in 2020 but accounted for only 3% of abortions that year, while just 1% of abortions were conducted by physicians’ offices.
Looking just at clinics – that is, the total number of specialized abortion clinics and nonspecialized clinics in the U.S. – Guttmacher found the total virtually unchanged between 2017 (808 clinics) and 2020 (807 clinics). However, there were regional differences. In the Midwest, the number of clinics that provide abortions increased by 11% during those years, and in the West by 6%. The number of clinics decreased during those years by 9% in the Northeast and 3% in the South.
The total number of abortion providers has declined dramatically since the 1980s. In 1982, according to Guttmacher, there were 2,908 facilities providing abortions in the U.S., including 789 clinics, 1,405 hospitals and 714 physicians’ offices.
The CDC does not track the number of abortion providers.
What percentage of abortions are for women who live in a different state from the abortion provider?
In the District of Columbia and the 46 states that provided abortion and residency information to the CDC in 2021, 10.9% of all abortions were performed on women known to live outside the state where the abortion occurred – slightly higher than the percentage in 2020 (9.7%). That year, D.C. and 46 states (though not the same ones as in 2021) reported abortion and residency data. (The total number of abortions used in these calculations included figures for women with both known and unknown residential status.)
The share of reported abortions performed on women outside their state of residence was much higher before the 1973 Roe decision that stopped states from banning abortion. In 1972, 41% of all abortions in D.C. and the 20 states that provided this information to the CDC that year were performed on women outside their state of residence. In 1973, the corresponding figure was 21% in the District of Columbia and the 41 states that provided this information, and in 1974 it was 11% in D.C. and the 43 states that provided data.
What are the demographics of women who have had abortions?
In the District of Columbia and the 46 states that reported age data to the CDC in 2021, the majority of women who had abortions (57%) were in their 20s, while about three-in-ten (31%) were in their 30s. Teens ages 13 to 19 accounted for 8% of those who had abortions, while women ages 40 to 44 accounted for about 4%.
The vast majority of women who had abortions in 2021 were unmarried (87%), while married women accounted for 13%, according to the CDC, which had data on this from 37 states.
In the District of Columbia, New York City (but not the rest of New York) and the 31 states that reported racial and ethnic data on abortion to the CDC, 42% of all women who had abortions in 2021 were non-Hispanic Black, while 30% were non-Hispanic White, 22% were Hispanic and 6% were of other races.
Looking at abortion rates among those ages 15 to 44, there were 28.6 abortions per 1,000 non-Hispanic Black women in 2021; 12.3 abortions per 1,000 Hispanic women; 6.4 abortions per 1,000 non-Hispanic White women; and 9.2 abortions per 1,000 women of other races, the CDC reported from those same 31 states, D.C. and New York City.
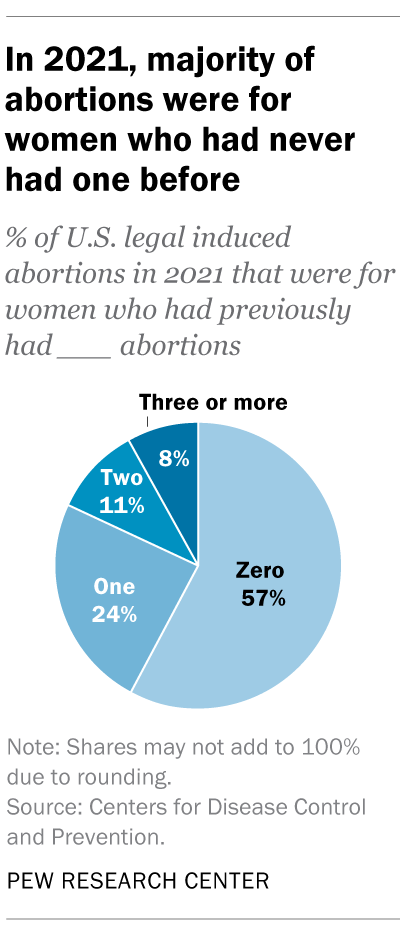
For 57% of U.S. women who had induced abortions in 2021, it was the first time they had ever had one, according to the CDC. For nearly a quarter (24%), it was their second abortion. For 11% of women who had an abortion that year, it was their third, and for 8% it was their fourth or more. These CDC figures include data from 41 states and New York City, but not the rest of New York.
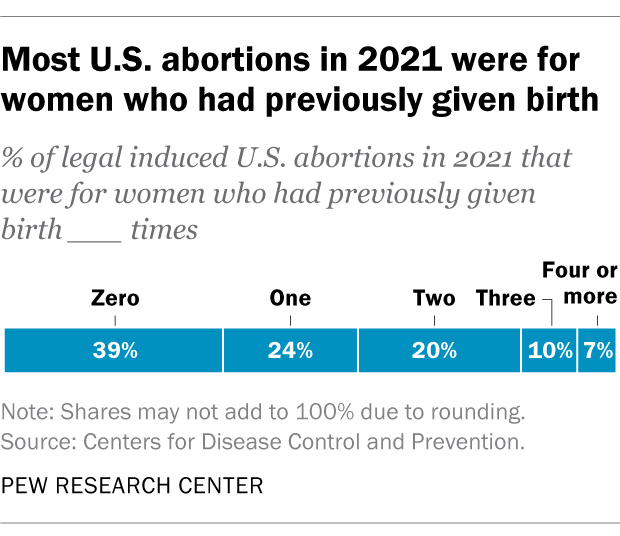
Nearly four-in-ten women who had abortions in 2021 (39%) had no previous live births at the time they had an abortion, according to the CDC. Almost a quarter (24%) of women who had abortions in 2021 had one previous live birth, 20% had two previous live births, 10% had three, and 7% had four or more previous live births. These CDC figures include data from 41 states and New York City, but not the rest of New York.
When during pregnancy do most abortions occur?
The vast majority of abortions occur during the first trimester of a pregnancy. In 2021, 93% of abortions occurred during the first trimester – that is, at or before 13 weeks of gestation, according to the CDC. An additional 6% occurred between 14 and 20 weeks of pregnancy, and about 1% were performed at 21 weeks or more of gestation. These CDC figures include data from 40 states and New York City, but not the rest of New York.
How often are there medical complications from abortion?
About 2% of all abortions in the U.S. involve some type of complication for the woman, according to an article in StatPearls, an online health care resource. “Most complications are considered minor such as pain, bleeding, infection and post-anesthesia complications,” according to the article.
The CDC calculates case-fatality rates for women from induced abortions – that is, how many women die from abortion-related complications, for every 100,000 legal abortions that occur in the U.S. The rate was lowest during the most recent period examined by the agency (2013 to 2020), when there were 0.45 deaths to women per 100,000 legal induced abortions. The case-fatality rate reported by the CDC was highest during the first period examined by the agency (1973 to 1977), when it was 2.09 deaths to women per 100,000 legal induced abortions. During the five-year periods in between, the figure ranged from 0.52 (from 1993 to 1997) to 0.78 (from 1978 to 1982).
The CDC calculates death rates by five-year and seven-year periods because of year-to-year fluctuation in the numbers and due to the relatively low number of women who die from legal induced abortions.
In 2020, the last year for which the CDC has information, six women in the U.S. died due to complications from induced abortions. Four women died in this way in 2019, two in 2018, and three in 2017. (These deaths all followed legal abortions.) Since 1990, the annual number of deaths among women due to legal induced abortion has ranged from two to 12.
The annual number of reported deaths from induced abortions (legal and illegal) tended to be higher in the 1980s, when it ranged from nine to 16, and from 1972 to 1979, when it ranged from 13 to 63. One driver of the decline was the drop in deaths from illegal abortions. There were 39 deaths from illegal abortions in 1972, the last full year before Roe v. Wade. The total fell to 19 in 1973 and to single digits or zero every year after that. (The number of deaths from legal abortions has also declined since then, though with some slight variation over time.)
The number of deaths from induced abortions was considerably higher in the 1960s than afterward. For instance, there were 119 deaths from induced abortions in 1963 and 99 in 1965, according to reports by the then-U.S. Department of Health, Education and Welfare, a precursor to the Department of Health and Human Services. The CDC is a division of Health and Human Services.
Note: This is an update of a post originally published May 27, 2022, and first updated June 24, 2022.


