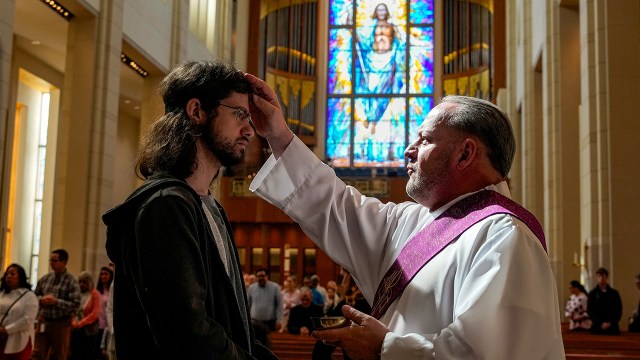
Catholics are one of the largest religious groups in the United States, outnumbering any single Protestant denomination. The U.S. has more Catholics than all but three other countries – Brazil, Mexico and the Philippines – according to the Vatican’s Statistical Yearbook of the Church.
Here are nine key facts about the U.S. Catholic population.
Pew Research Center conducted this analysis to serve as a reference source on the basic demographic attributes, religious characteristics and political preferences of U.S. Catholics.
The analysis draws mainly on data from the Center’s National Public Opinion Reference Surveys (NPORS) conducted in 2022 and 2023. NPORS is an annual survey of U.S. adults who are selected for participation using address-based sampling from the U.S. Postal Service’s Delivery Sequence File. Respondents may answer either by paper or online.
This post also relies on a variety of surveys conducted online among respondents who are part of the Center’s American Trends Panel or other national survey panels recruited through random sampling (not “opt-in” polls).
All of the surveys used in this analysis are weighted to be representative of the U.S. adult population by gender, race, ethnicity, education and other categories.
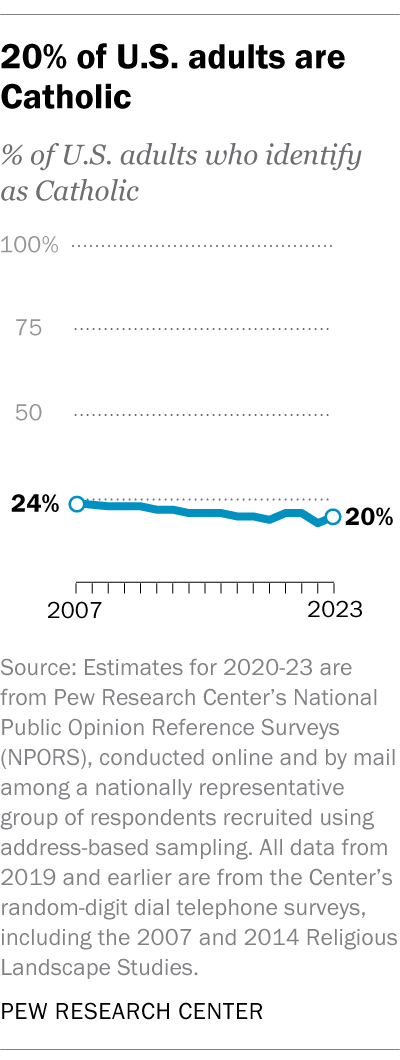
Today, 20% of U.S. adults describe themselves as Catholics, according to our latest survey. This percentage has been generally stable since 2014. But it is slightly lower than in 2007, when 24% of U.S. adults identified as Catholic.
Overall, there were about 262 million adults in the U.S. in 2023, according to the U.S. Census Bureau. This suggests that there are roughly 52 million Catholic adults nationwide.
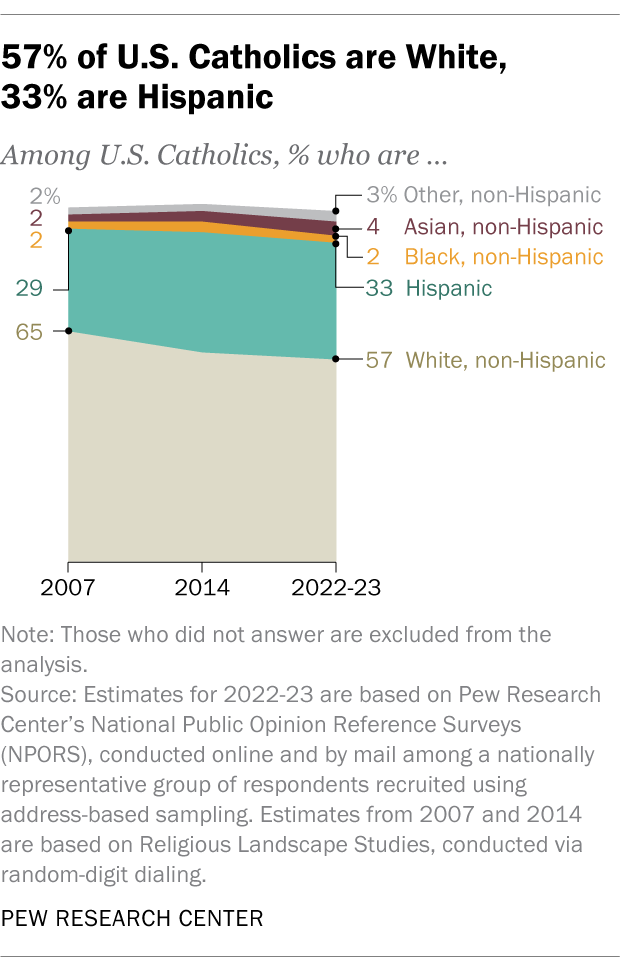
Most U.S. Catholics are White, but a third are Hispanic. The Catholic population is 57% White, 33% Hispanic, 4% Asian and 2% Black, while 3% are of another race.
Since 2007, the share of U.S. Catholics who are White has dropped by 8 percentage points, while the share who are Hispanic has ticked upward by 4 points.
This change has implications for the profile of Catholic Americans as a whole because White Catholics have distinctive social and political traits, as we’ll discuss in more detail below.
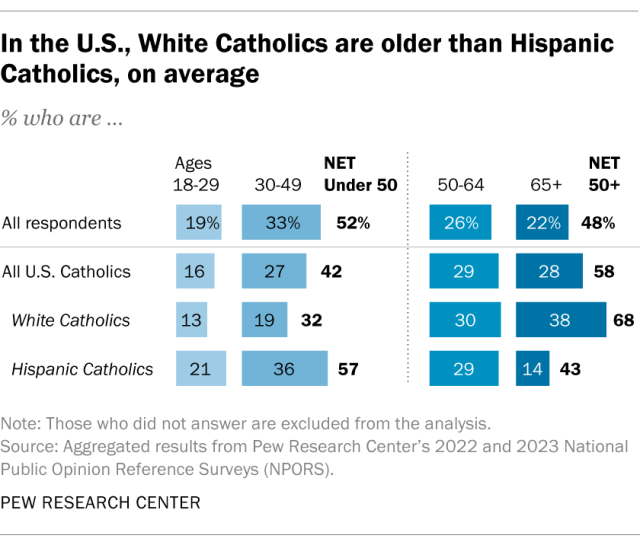
Catholics tend to be older than Americans overall. Nearly six-in-ten Catholic adults (58%) are ages 50 and older. Among all U.S. adults in the survey, by comparison, 48% fall in this age range.
But Hispanic Catholics tend to be a lot younger than White Catholics. Fewer than half of Hispanic Catholics (43%) are 50 and older, compared with about two-thirds (68%) of White Catholics. And just 14% of Hispanic Catholics are ages 65 and older, versus 38% of White Catholics.
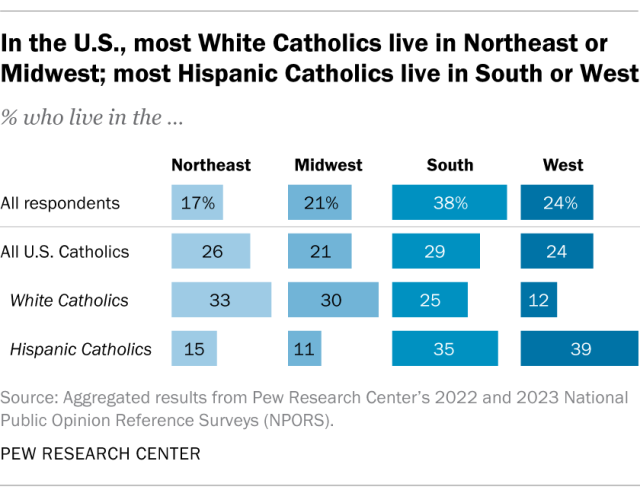
Roughly three-in-ten U.S. Catholics (29%) live in the South, while 26% live in the Northeast, 24% in the West and 21% in the Midwest.
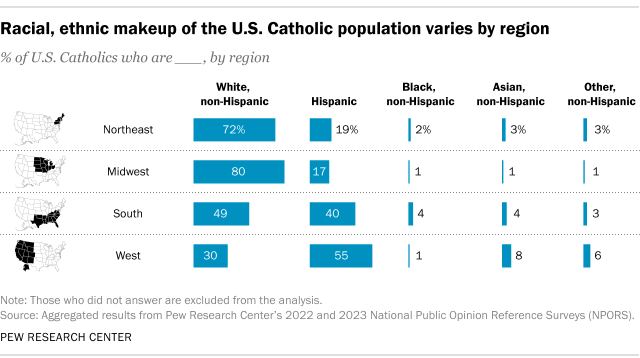
The racial and ethnic profile of the Catholic population varies considerably by region. For example, in the Midwest, 80% of Catholics are White and 17% are Hispanic. In the Northeast, 72% of Catholics are White and 19% are Hispanic.
In the South, 49% are White and 40% are Hispanic. And in the West, there are more Hispanic Catholics than White Catholics (55% vs. 30%).
About a third of U.S. Catholics (32%) have a bachelor’s degree. Another 28% have some college experience but not a bachelor’s degree, and 40% have a high school education or less. This distribution is similar to that of the general adult population.
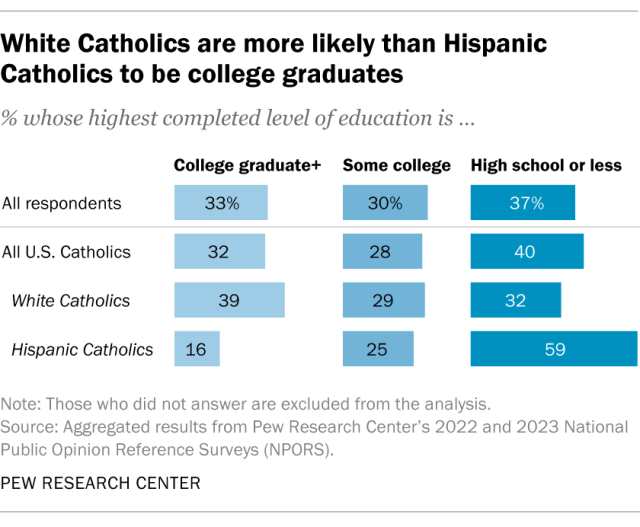
On average, White Catholics have higher levels of educational attainment than Hispanic Catholics. Roughly four-in-ten White Catholics (39%) have at least a bachelor’s degree, while 32% have a high school education or less. Among Hispanic Catholics, 16% have a bachelor’s degree and 59% have a high school education or less.
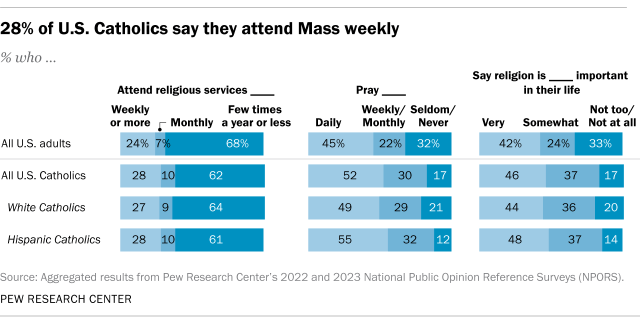
About three-in-ten U.S. Catholics (28%) say they attend Mass weekly or more often. Larger shares of Catholics say they pray on a daily basis (52%) and say religion is very important in their life (46%).
Overall, 20% of U.S. Catholics say they attend Mass weekly and pray daily and consider religion very important in their life. By contrast, 10% of Catholics say they attend Mass a few times a year or less often and pray seldom or never and consider religion not too or not all important in their life.
By way of comparison, 40% of U.S. Protestants say they attend services at least weekly. And about two-thirds of Protestants pray daily (67%) and say religion is very important in their life (66%).
About half of Catholic registered voters (52%) identify with or lean toward the Republican Party, while 44% affiliate with the Democratic Party.
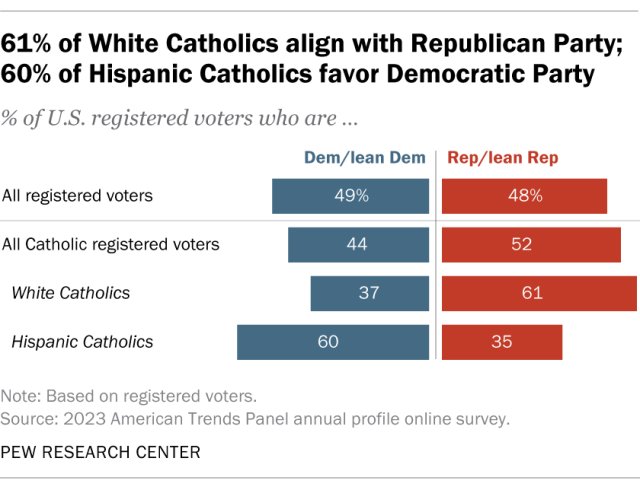
But partisan affiliation varies by race and ethnicity. Roughly six-in-ten White Catholic registered voters (61%) say they identify with or lean toward the GOP, compared with 35% of Hispanic Catholics.
Conversely, 60% of Hispanic Catholics who are registered voters say they identify with or lean toward the Democratic Party, compared with 37% of White Catholics.
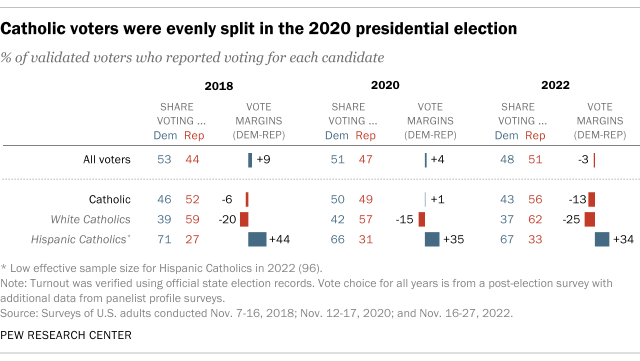
In the 2022 congressional midterm elections, 56% of Catholics said they voted for Republican candidates, while 43% backed Democrats. And in the 2020 presidential election, Catholic voters were split down the middle: 49% backed Donald Trump and 50% voted for Joe Biden.
These overall splits hide big differences between White and Hispanic Catholic voters. For example, White Catholics favored Trump over Biden by a 15-point margin in 2020, while Hispanic Catholics backed Biden over Trump by a 35-point margin.
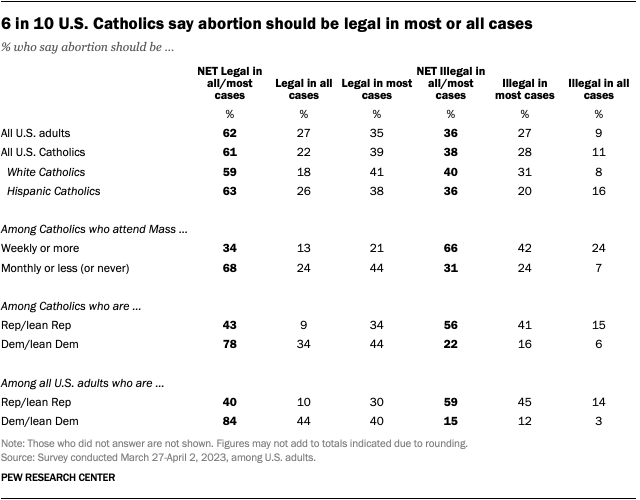
While the Catholic Church opposes abortion, about six-in-ten Catholics say abortion should be legal. This includes 39% who say it should be legal in most cases and 22% who say it should be legal in all cases. Roughly four-in-ten Catholics say abortion should be illegal in most (28%) or all (11%) cases.
Catholics’ opinions about abortion tend to align with their political leanings. Among Catholic Democrats, 78% say abortion should be legal in most or all cases. Among Catholic Republicans, 43% say this.
Catholic Democrats are a little less likely than non-Catholic Democrats to say abortion should be legal in most or all cases (78% vs. 86%).
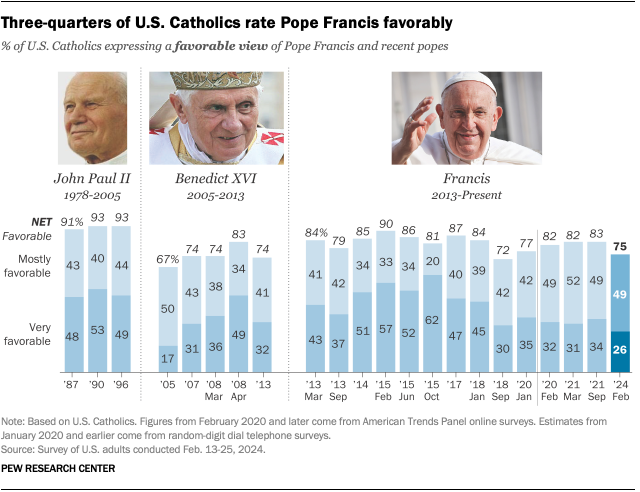
Three-quarters of Catholics view Pope Francis favorably, according to our February 2024 survey. That’s a little lower than the 80% of Catholics or more who expressed a positive view of Francis in many previous polls during his papacy, which began in 2013.
Catholic Democrats (89%) are much more likely than Catholic Republicans (63%) to view Francis favorably.
Note: This is an update of a post originally published Sept. 4, 2018.