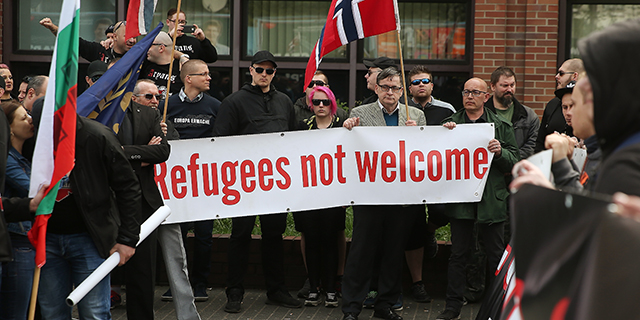
Nationalist and anti-immigrant attitudes in Western Europe have been an issue in a number of recent national elections around the region, particularly after the influx in the past few years of refugees from predominantly Muslim countries. But Western Europeans vary by country when it comes to having positive or negative views about immigrants and religious minorities, according to a Pew Research Center analysis.
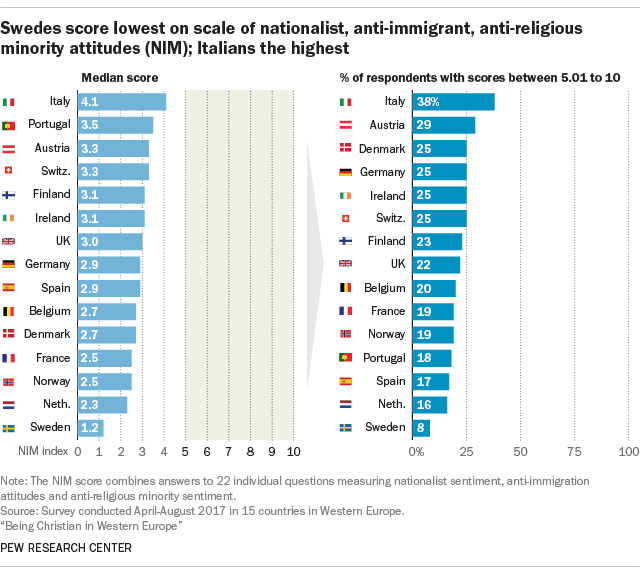
To better examine the prevalence of these attitudes, the Center developed a scale to measure the extent of Nationalist, anti-Immigrant and anti-religious Minority (NIM) sentiment. The NIM scale combines answers to 22 survey questions on a wide range of issues including views on Muslims, Jews and immigrants, as well as immigration policy.
Respondents’ scores increased if they said that immigration to their country should be reduced; that they were unwilling to be neighbors or relatives with Muslims or Jews; that immigrants from certain regions are not honest or hardworking; that Islam is fundamentally incompatible with their national culture and values; that being born in their country is important to being “truly French,” “truly German,” etc.; and for expressing a host of other sentiments on related topics. The higher the score, the more likely a respondent had expressed nationalist, anti-immigrant and anti-religious minority sentiments during the survey. Scores on the scale range from 0 to 10.
Relatively few adults in every country surveyed score above 5 on the scale. But there is considerable variation across countries. In Sweden, just 8% of those surveyed scored higher than 5, the lowest amount in any country, while in Italy, 38% did, the highest share in any country. In most countries, the share scoring 5.01 or higher was between 15% and 25%. For example, in both Norway and France, 19% of respondents scored 5.01 or higher.
The NIM scale also provides an opportunity to explore whether factors such as age, political ideology or religious affiliation are associated with these kinds of attitudes. The analysis finds that:
- People who describe themselves as being on the “political right” are more likely to score higher on the scale of nationalist, anti-immigrant and anti-religious minority attitudes than are those who place themselves on the “political left.” In most countries surveyed, the median score of those identifying with the political right is at least 1.5 points higher than that for those identifying with the political left. In Austria, for example, the median NIM score is 3.3 overall, but 6.2 for those identifying with the political right and 2.3 for those identifying with the political left. (Click here for a full analysis about how political ideology was coded.)
- In most countries surveyed, the median score of people who identify as Christian is at least a full point higher than the median values among religiously unaffiliated respondents. The largest such gaps are in Denmark (where median scores of Christians are 1.9 points higher), Germany (1.8 points), France (1.7 points) and Italy (1.7 points). In Italy, for example, the median score for Christians is 4.5, compared with 2.8 for religiously unaffiliated adults.
- Personal familiarity with Muslims is associated with lower NIM scores. To a lesser extent, the same pattern holds for those who personally know someone who is Jewish, although significantly more people in Europe today say they are personally acquainted with Muslims than with Jews.
- In all countries surveyed, younger adults have lower median scores on the NIM scale than do older people. For example, in Italy, adults younger than 35 have a median NIM score of 3.3, while older Italians have a median of 4.4. And in Denmark, younger adults have a median NIM score of 1.6, while for older Danes the median score is 3.3.
While younger people tend to score lower on the NIM, statistical analysis suggests that, in Western Europe overall, this has less to do with their age and more to do with factors like religion and familiarity with Muslims. For example, younger Western Europeans are more likely to say they personally know a Muslim and to say they are religiously unaffiliated; both of these factors are closely associated with lower NIM scores.