Public debt has increased sharply in many countries in recent years, particularly during and after the Great Recession. Globally, the total amount of government debt now exceeds $63.1 trillion, according to a Pew Research Center analysis of International Monetary Fund data.
Here are five facts about government debt around the world. This analysis is based on IMF data for 43 countries that are members of the Group of Twenty or the Organization for Economic Co-operation and Development. The figures used are for consolidated debt issued by all levels of government, less debt held by other governmental units (unless otherwise noted).
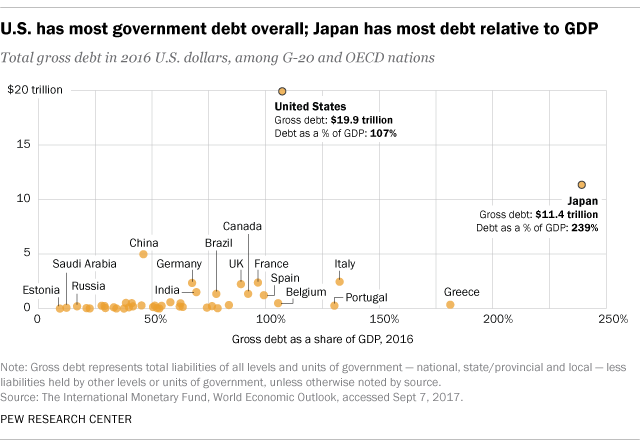
The United States has more government debt than any other country analyzed, with nearly $20 trillion in gross debt in 2016. Japan was second, with 1,285 trillion yen (more than $11 trillion in 2016 dollars), followed by China with 34.5 trillion yuan (nearly $5 trillion). (Gross debt refers to all public debt – including intragovernmental debt, or what the government owes itself. Net debt, by contrast, is gross debt minus government assets related to debt, such as pensions for government workers.)
Worldwide, public debt is still significantly lower than total debt owed by the private sector. Private debt made up about two-thirds of all non-financial-sector global debt in 2015.
As a share of its GDP, Japan’s gross debt far exceeds that of all other nations analyzed. Japan’s gross public debt was more than twice its gross domestic product in 2016, far higher than the debt-to-GDP ratio of most other countries examined. Public debt in Greece, Italy, Portugal, the U.S. and Belgium also exceeded GDP. The reasons for each country’s debt load vary, but in Japan and elsewhere, an aging population has contributed.
The median debt-to-GDP ratio across the 43 countries analyzed was 54.2% in 2016. Estonia, Saudi Arabia and Russia had among the least gross debt relative to GDP.
Experts differ on what constitutes an appropriate or “safe” level of public debt relative to GDP. One analysis by Moody’s Analytics categorized countries into four different levels of debt urgency. The analysis raised red flags about several countries, including Japan, Italy and Greece. But it found that debt levels in other countries, including the U.S., Canada and the United Kingdom, were “safe.”
A 2014 Pew Research Center survey found that public debt was a top concern in many advanced economies, with a median of 64% citing it as a very big problem.
Norway’s GDP far outweighs its net debt. While Norway’s gross debt was 33% of its GDP in 2016, its net debt was -284.5% of its GDP. In other words, excluding intragovernmental debt, Norway’s public financial assets far exceeded its total debt. Other countries where financial assets exceeded net debt include Finland (-51.4%), Saudi Arabia (-18.9%) and Sweden (-18.3). Across the 27 analyzed countries for which the IMF has data, net public debt in 2016 was 42.9% of GDP. The country with the greatest share of net debt was Portugal, at 120.9% of GDP. Japan followed at 119.8%, but that number was half the country’s gross debt as a share of GDP.
Brazil spends more than any other country analyzed on debt interest payments as a share of revenue. In 2015, the most recent year for which data are available, the Brazilian government spent 42.1% of its revenue on interest payments, up from 28.8% the year before. (Data for China, India, Mexico and Saudi Arabia were not available.) Debt is widely perceived as a problem in South America’s most populous nation: 91% of Brazilians said in a 2017 Pew Research Center survey that public debt is a very or moderately big problem.
Spain and Iceland spent the second- and third-most on debt interest payments in 2015, with 15.6% and 13.5% of their total government revenue, respectively, going to interest. The governments of Estonia, Norway and Luxembourg spent 1% or less of their revenue on debt interest payments. The global median of interest payments as a share of revenue was 5.5%.
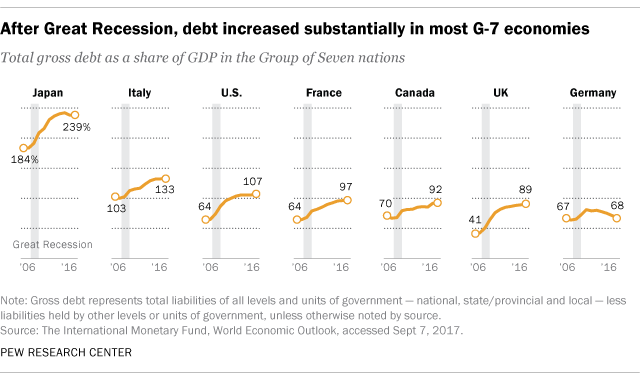
Debt as a percentage of GDP increased in 34 of 43 countries between 2006 and 2016. Across most countries in this analysis, gross debt as a percentage of GDP increased substantially after the Great Recession. In the world’s seven major advanced economies (known as the Group of Seven), debt as a share of GDP increased by an average of 22.2% between 2008 and 2011. As of 2016, Germany was the only G-7 country that had scaled its debt-to-GDP ratio back to pre-recession levels. (The increase in debt as a share of GDP reflects not just increased borrowing, but slowing productivity: In 2009 alone, for example, global GDP growth was -1.74%.)
Six countries saw their debt as a share of GDP increase by more than 50% between 2006 and 2016: Greece (increase of 77.8%), Portugal (68.7%), Spain (60.4%), Japan (54.9%), Slovenia (52.9%) and Ireland (52.8%). Overall, median debt growth as a percentage of GDP was 16.2% between 2006 and 2016.
Conversely, nine countries decreased their debt levels between 2006 and 2016: Norway (-19.1%), Israel (-17.9%), Turkey (-15.6%), Saudi Arabia (-13.5), Indonesia (-8%), India (-7.6%), Argentina (-7.4%), Switzerland (-5.2%) and Sweden (-1.3%).
A recent drop in oil prices has also affected the debt levels of nations that depend heavily on oil. In the case of Saudi Arabia, for example, the country’s gross government debt as a share of GDP increased by nearly 11 percentage points between 2014 and 2016. 2015 was the first year since 2009 that the country experienced any increase in debt relative to its GDP.
Note: See full topline results here (PDF).