The number of legal permanent residents applying for U.S. citizenship in the nine months starting last October is at its highest level in four years, and it is up 8% from the same period before the 2012 elections. Although some organizers of naturalization and voter registration drives have suggested the increase is a reaction to Donald Trump’s candidacy, a Pew Research Center analysis of naturalization data shows there have been much larger percentage increases in past years, with jumps not always coming during election years.
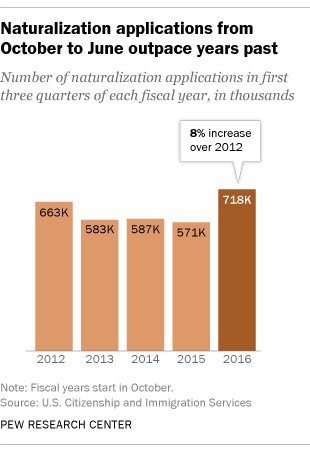
So far this fiscal year – from October 2015 to June 2016 – 718,430 immigrants have applied for naturalization, a 26% increase over the same time period a year before, according to data released by U.S. Citizenship and Immigration Services. By comparison, the number of naturalization applications increased by 19% in fiscal 2012 over the previous year.
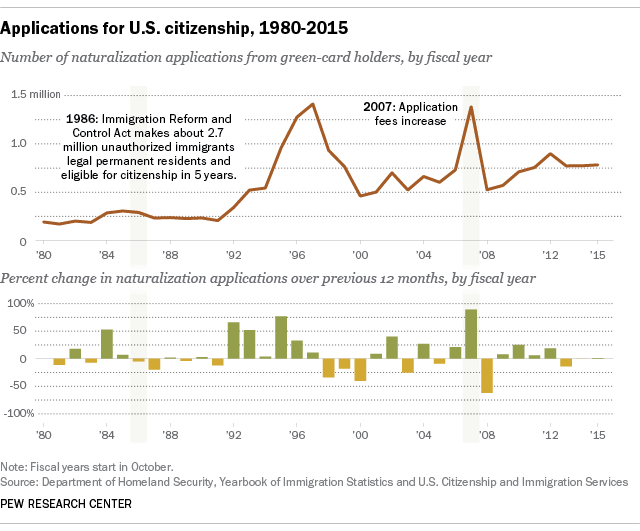
But application numbers don’t always increase during presidential election years. In fact, many past spikes have occurred for more practical reasons, such as a pending fee increase.
In fiscal 2008, the number of applications decreased by 62% compared with the previous year. This was because an unusually large number of naturalization applications were filed in fiscal 2007 ahead of an increase in the application fee for adults, from $330 to $595, planned for July 30, 2007. In fact, the number of applications in fiscal 2007 spiked to nearly 1.4 million, an 89% increase over the previous year – the single largest annual increase since the government started tracking naturalization applications in 1907.
The second-largest annual percentage increase in applications came in the mid-1990s. From fiscal 1995 to 1998, 900,000 or more people applied for citizenship each year, with a peak of 1.4 million in 1997, a record high. Several laws passed by Congress starting in the mid-1980s may have helped drive up applications. The Immigration Reform and Control Act of 1986 increased the pool of potential naturalization applicants by making an estimated 2.7 million unauthorized immigrants legal permanent residents. A decade later, many of those immigrants had applied for citizenship. (By 2009, about 40% who obtained green cards had become citizens.) In 1996, Congress also passed three laws that limited the public benefits and legal protections of noncitizens, and expanded the list of offenses for which immigrants – including legal permanent residents – can be deported.
In 2013, an estimated 8.8 million legal permanent residents were eligible for citizenship in the U.S., with most from Latin America (3.9 million) or Asia (1.5 million), according to government estimates. About 2.7 million are from Mexico alone, though Mexican immigrants have long been less likely to naturalize than other immigrants.
This election cycle, several groups (including the White House) have launched efforts to increase the number of naturalized immigrants as part of larger efforts to boost turnout among Latinos and other groups. Latinos and Asians have long favored Democratic presidential candidates in past elections.
While Hispanics and Asians have long had significantly lower voter turnout rates than whites and blacks, Hispanics and Asians who are naturalized citizens tend to have higher voter turnout rates than their U.S.-born counterparts. In 2012, naturalized-immigrant Hispanics had a voter turnout rate of 54%, compared with a 46% turnout rate among U.S.-born Hispanics. Among Asians, the turnout rate for naturalized immigrants was 49%, compared with 43% for the U.S. born. (Voter turnout among white immigrants that year was 55%, compared with 64% among U.S.-born whites. Among blacks, turnout was 62% among immigrants and 67% among the U.S. born.) In 2016, naturalized immigrants make up 24% of Hispanic eligible voters and 61% of Asian eligible voters.
Though not yet available, it’s possible the data will show applications will have continued to rise this summer and into September, though it’s unlikely these new applicants will become naturalized in time to register to vote. Naturalization applications generally take six to seven months to process, and Election Day is Nov. 8. In addition, starting Oct. 1 the naturalization fee will increase for some immigrants (though low-income applicants would pay a discounted rate), which may also drive an increase in applications.
This is an updated version of a post originally published on May 13, 2016.