For nearly all of the past three decades, Americans have looked somewhat more favorably upon labor unions than unfavorably, according to Pew Research Center polling. In a new survey, for instance, nearly half of Americans (48%) held favorable views of unions, versus 39% who had unfavorable views. But those fairly benign views come as union membership continues to plummet, with certain job categories hit particularly hard.

About a fifth (20.1%) of wage and salary workers belonged to a union in 1983, according to the Bureau of Labor Statistics. By last year, that figure had plunged to 11.1%. (Unionization peaked in 1954 at 34.8% of all U.S. wage and salary workers, according to the Congressional Research Service.)
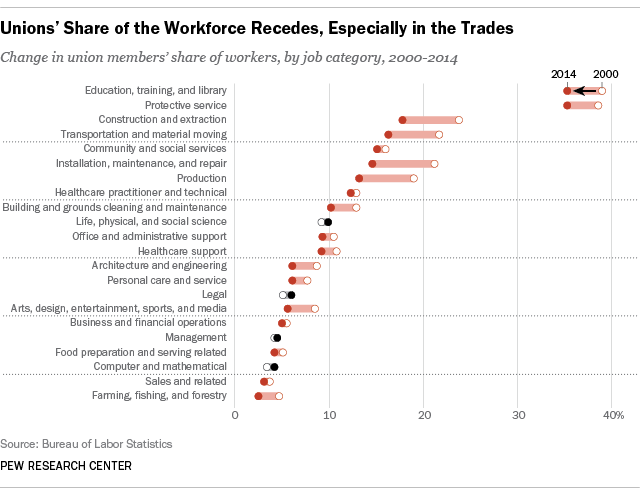
The decline of organized labor has affected nearly all occupational groups, but not uniformly, according to our analysis of BLS unionization data going back to 2000. The biggest declines, in fact, have come in occupations that were – and still are – among the most unionized in the country, especially those dominated by the private sector.
From 2000 to 2014, the biggest decline was in installation, maintenance and repair occupations, a broad grouping that includes everything from auto mechanics to avionics technicians and watch repairers. In 2000, 21.2% of the 4.4 million workers in those occupations were union members, compared with 14.6% last year (though total employment was up by 85,000). Over that same timespan, unionization rates in construction and extraction occupations (such as carpenters, oilfield workers and miners) fell from 23.8% to 17.8%.
The manufacturing-type jobs that once were the foundation of the U.S. labor movement have shriveled in both absolute and percentage terms. In 2000, 19% of the 11.1 million Americans in production occupations (2.1 million) were union members. Last year, total employment in those occupations was 8.1 million, only 13.2% (or 1.1 million) of whom were union.
Last year, the two groups with the highest unionization levels were protective service occupations (such as police officers, firefighters and security guards) and education, training and library occupations, both at 35.3%. Not surprisingly, both groups are composed largely of public-sector workers. Federal, state and local governments have far higher unionization rates overall (ranging from 27.5% to nearly 42%) than the private sector (6.6%). But unionization has slipped even among those groups: In 2000, 39% of people in education, training and library occupations and 38.6% of people in protective service occupations were unionized.
A few, fairly small groups (legal occupations; life, physical and social science occupations; computer and mathematical occupations) did experience small increases in their unionization rates between 2000 and 2014, albeit from below-average bases. Interestingly, “management occupations,” which would seem to be the antithesis of labor unions, showed increases in both the number of union members (from 438,000 to 562,000) and in unionization rate (4.2% to 4.5%). But that category includes a lot more than C-suite executives: school administrators, construction foremen, food-service managers and other supervisory personnel.
Despite the declines in actual unionization, majorities of Americans surveyed by Pew Research say many different types of workers should have the right to unionize. Of the six types of workers Pew Research asked about, public support for unionizing ranged from 62% (fast-food workers) to 82% (manufacturing and factory workers).