Every month, the federal Bureau of Labor Statistics releases a flood of data about employment and unemployment in the U.S. And every month, the lion’s share of the attention goes to one figure – the unemployment rate, which was a seasonally adjusted 4.8% in January. (The February report comes out on Friday.)
But the unemployment rate is just one indicator of how the U.S. economy is doing, and it’s not always the best one. Simply being out of work isn’t enough for a person to be counted as unemployed; he or she also has to be available to work and actively looking for work (or on temporary layoff). In any given month, the unemployment rate can rise or fall based not just on how many people find or lose jobs, but on how many join or leave the active labor force.
There are, in fact, five other monthly measures of what the BLS calls “labor underutilization” besides the official unemployment rate, as well as scores of other measurements – labor force participation rates, employment-population ratios, average weekly wages, average hours worked and more. Knowing what those other data points are, where they come from and how they’re calculated is critical in understanding what they do – and don’t – tell us about the nation’s workers.
Take the concept of unemployment. Since U.S. economists first began trying to systematically measure unemployment in the 1870s, one of the main issues has been defining exactly what “being unemployed” means – since many people who don’t have jobs, such as retirees and students, may not actually want paying work. (As the BLS itself noted once upon a time, “Being employed is an observable experience, while being unemployed often lacks that same concreteness.”)
Since 1945, the official definition has been that to be considered unemployed, you must not only not have a job but be available for work (i.e., not too sick to work) and have actively looked for a job in the past four weeks. If you’re neither employed nor, according to the official definition, unemployed, you’re not considered part of the labor force.
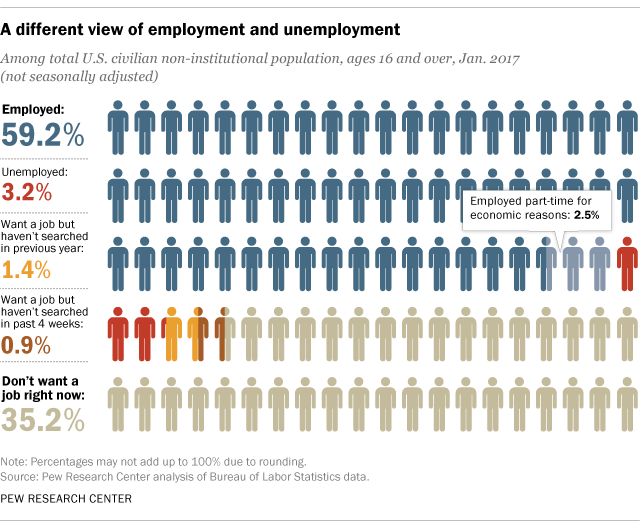
The BLS derives its unemployment data from the Census Bureau’s Current Population Survey, which interviews about 60,000 people each month (and not, as is sometimes supposed, by counting how many people drew unemployment benefits). The CPS covers the entire civilian non-institutional population ages 16 and older, including self-employed people; prison inmates, residents of mental facilities and homes for the aged, and active-duty military personnel are excluded. (A separate survey of 146,000 private- and public-sector employers produces the monthly nonfarm-payroll numbers.)
Since 1994, no major changes have been made in how unemployment is measured, though there have been some modest updates to the CPS over time. For example, a 2010 change raised the upper limit on reporting how long someone has been jobless from “99 weeks and over” to “260 weeks and over” in order to better track long-term unemployment.
As many observers have pointed out, the official unemployment definition leaves out some significant groups. The underemployed – part-time workers who would prefer to work full-time – are counted among the employed. And discouraged workers – people who’d like a job but have stopped looking because they don’t believe any work is available – aren’t counted as part of the labor force at all.
But the CPS asks people a lot more than whether they are working or searching for work. Questions include how long jobless people have been out of work, how recently they looked for work, why part-timers aren’t working full time, why people choose not to look for work, and even why people with jobs may not have been working during the survey period (for example, if they were sick, on vacation, temporarily laid off or snowed in).
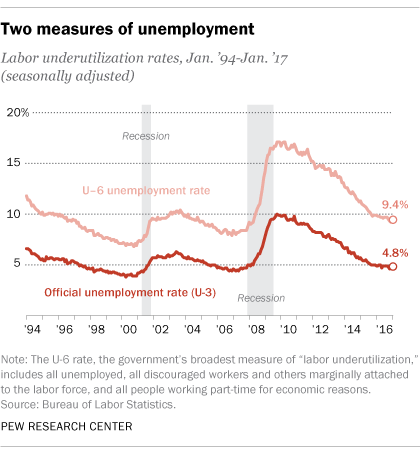
All that extra data enables the BLS to calculate six different measures of labor underutilization, labeled U-1 through U-6, with broader or narrower parameters than the official unemployment rate (which is known as U-3). The broadest, U-6, includes all “marginally attached” workers (including discouraged workers) and involuntary part-time workers. The seasonally adjusted U-6 rate stood at 9.4% in January; since 1994 it has ranged from 6.8% (in October 2000) to 17.1% (most recently in April 2010). While the U-6 typically runs anywhere from 3 to 7 percentage points higher than the regular unemployment rate, with the gap wider during recessions and narrower in good economic times, it tends to follow the same pattern as the official unemployment rate.
Beyond the unemployment rate, a key metric in the monthly jobs report is the labor force participation rate – the share of the 16-and-over civilian non-institutional population either working or looking for work. The participation rate rose for several decades, peaked in early 2000 at 67.3%, then began falling; in January it was 62.9%, about where it was in the late 1970s. Labor economists generally agree that waves of retiring Baby Boomers explain part (but not all) of the decline, which has been especially steep for men in their prime working years.
There’s also the employment-population ratio, which measures employed people as a percentage of the 16-and-over civilian non-institutional population. Though the ratio has some quirks, it’s less affected by seasonal variations or short-term fluctuations in labor-market behavior than the unemployment rate. According to the January jobs report, the seasonally adjusted employment-population ratio was 59.9%, three-tenths of a percentage point higher than it was a year earlier.
Like the labor force participation rate, the employment-population ratio can be affected by more people retiring or deciding to go back to school. That’s why many labor-market economists focus on the 25-to-54 age group, which strips out most students and retirees. In January, the employment-population ratio for that subgroup was a seasonally adjusted 78.2%, a figure that’s been constant for the past four months. While that’s better than it was during the long hangover from the Great Recession (only 75.2% of 25- to 54-year-olds were employed in January 2011), it’s still below the indicator’s pre-recession high (80.3% in January 2007).
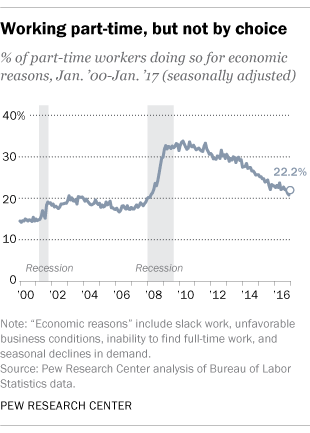
It’s also important to remember that not all employment is created equal. Before the Great Recession, fewer than 20% of all part-time workers said they were working less than 35 hours a week for economic reasons, such as slack demand or inability to find full-time work. During the slump, that share jumped to a third of all part-timers; the “involuntary part-time” share has fallen since, to 22.2% of all part-timers in January, but still is above typical pre-recession levels.
Note: This post has been updated with January 2017 unemployment data. It was originally published in June 2013.