As Americans hang fresh calendars and debut New Year’s resolutions, some will swear off alcohol, whether as part of a “Dry January” challenge or a longer-term goal. Here are 10 key facts about Americans’ behaviors and attitudes when it comes to drinking alcohol and how these have changed over time, drawn from surveys and sales data.
Pew Research Center conducted this analysis to understand Americans’ experiences with alcohol and how they have changed over time. Survey data comes from Gallup and the University of Michigan’s Monitoring the Future Survey. Data on Americans’ drinking habits comes from the National Institute on Alcoholism and Alcohol Abuse (NIAAA), and alcohol sales data is from the U.S. Census Bureau’s monthly retail sales survey.
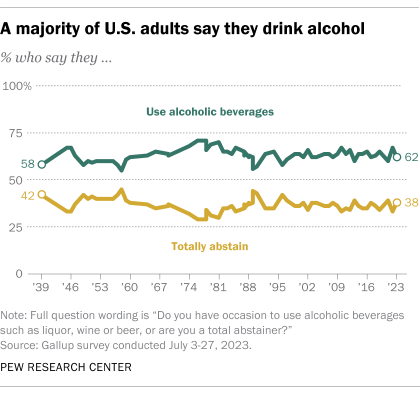
Overall, 62% of U.S. adults say they ever drink alcohol, while 38% abstain completely, according to a July 2023 Gallup survey. Gallup has asked Americans for more than eight decades whether they have “had occasion to use alcoholic beverages such as liquor, wine or beer.” During that span, majorities have consistently said they consume alcohol. This share peaked in the late 1970s, when 71% of adults said they drank alcohol.
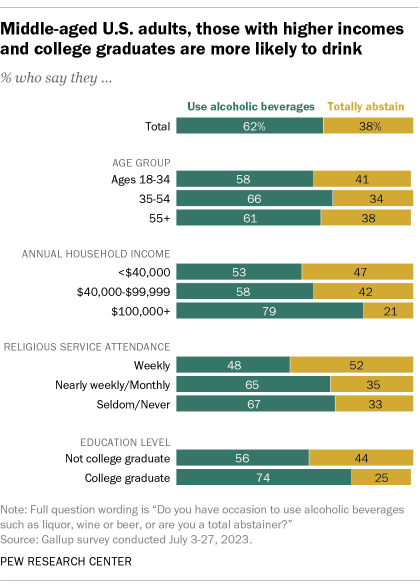
Adults ages 35 to 54, those with a college degree, those with household incomes of $100,000 or more, and those who attend church less than once a week are all more likely than other Americans to drink alcohol.
Most adults who consume alcohol have done so recently, according to the July Gallup survey. Among adults who drink, 69% say they last had a drink within the past week. This includes 32% whose most recent drink was in the last 24 hours, and 37% who most recently had one within the last two to seven days. Another 32% say they last consumed alcohol more than a week ago.
About one-in-five adults who drink alcohol (19%) say they sometimes drink more than they think they should, the Gallup survey shows. Some demographic groups are more likely than others to say this:
- Men: Men are more likely than women to say they sometimes overindulge (21% vs. 16%).
- Younger adults: About two-in-ten adults younger than 35 (22%) and ages 35 to 54 (20%) say this, compared with 14% of those 55 and older.
- Upper-income adults: 24% of adults with annual household incomes of at least $100,000 say they occasionally drink too much, compared with 10% of those with household incomes of less than $40,000.
Among adults who don’t drink, the most common reason given is that they just don’t want to, the Gallup survey found. About a quarter of nondrinkers (24%) say in an open-ended question that they have no desire to drink or do not want to.
Other common answers include that they do not like drinking (16%); it is unhealthy (14%); they are afraid of the consequences (13%); and they had a bad past experience with alcohol (13%).
On average, Americans have been consuming more alcohol in recent years, according to the National Institute on Alcohol Abuse and Alcoholism (NIAAA), which has data going back to 1970. In 2021, the most recent year with data, the average American age 21 or older consumed 2.83 gallons of pure alcohol – the equivalent of about 603 “standard drinks.” (A standard drink, per the NIAAA, contains 0.6 ounces of alcohol.)
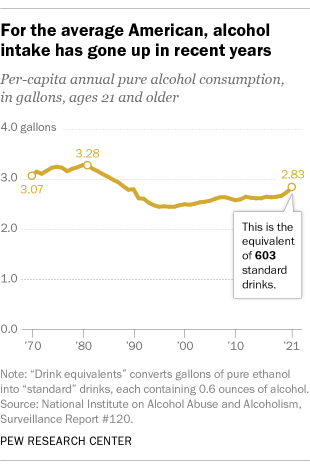
Per-capita alcohol consumption peaked in the early 1980s at 3.28 gallons, or almost 700 drinks. It bottomed out in the late 1990s at 2.45 gallons per person, or about 523 drinks.
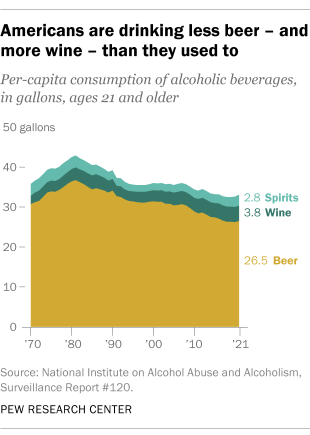
Americans drink less beer and more wine than they used to, according to the NIAAA. Since 1970, the peak year for beer consumption was 1981, when the typical American age 21 or older drank 36.7 gallons. By 2021, beer consumption had fallen to 26.5 gallons per person. Over those four decades, the amount of wine the average American drank annually rose from 3.2 gallons to 3.8 gallons. Meanwhile, consumption of distilled spirits dropped slightly, from 3.0 to 2.8 gallons.
Looked at another way, 17.4% of all alcohol consumed by Americans in 2021 came from wine, up from 12.0% in 1971. The share coming from beer fell from 44.6% to 42.3% during the same period, while the share coming from spirits fell from 43.5% to 40.3%.
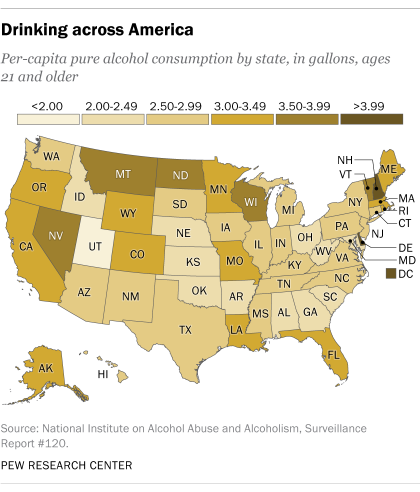
Per-capita alcohol consumption appears to be highest in the West and lowest in the South, based on the NIAAA data. On the state level, it appears to be highest in New Hampshire and Delaware, and lowest in Utah. However, state-level consumption estimates can be affected by such factors as sales to people from neighboring states (especially when there are significant differences in alcohol tax rates) and alcohol consumption by tourists (think Nevada, Florida, and Washington, D.C.).
Young adults today are less likely to drink than young adults two decades ago – but older adults are more likely to do so, according to Gallup. The share of adults ages 18 to 34 who say they ever drink dropped from 72% in 2001-03 to 62% in 2021-23. (Gallup looked at the data in three-year time periods to allow for reliable age-group analysis.)
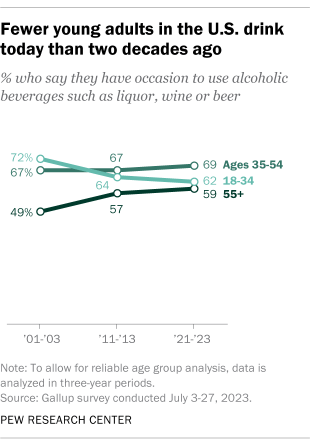
Young adults who drink, meanwhile, are less likely than those two decades ago to have had a drink recently: 61% say they had a drink in the week before the survey, compared with 67% in the early 2000s. And the share who say they sometimes drink more than they think they should has declined from 28% in the early 2000s to 22% now.
Americans 55 and older, on the other hand, are more likely than their counterparts two decades ago to say they do all of these things. Among those ages 35 to 54, the shares who do these things have remained relatively stable over time.
Underage drinking among U.S. teens has declined over the last 20 years, according to the University of Michigan’s Monitoring the Future survey. In 2023, 46% of 12th graders said they had consumed alcohol in the 12 months prior to the survey, as did 31% of 10th graders and 15% of eighth graders. These shares are down from 2001, when 73% of 12th graders, 64% of 10th graders and 42% of eighth graders said they had drunk alcohol in the previous year.
Across all three grade levels, the shares who said they had drunk alcohol in the 30 days prior to the survey and who reported binge drinking – having five or more drinks in a row during the last two weeks – also declined between 2001 and 2023.
Annual sales at beer, wine and liquor stores have been on the rise, typically peaking each year in December. Even after adjusting for inflation, sales at beer, wine and liquor stores rose gradually throughout the 2000s and 2010s, until spiking in the early months of the COVID-19 pandemic. Since midsummer 2020, sales volume has gradually fallen, though it remains above pre-pandemic levels. (Not all alcoholic beverages are bought at beer, wine and liquor stores, but these figures provide insight into broader trends.)
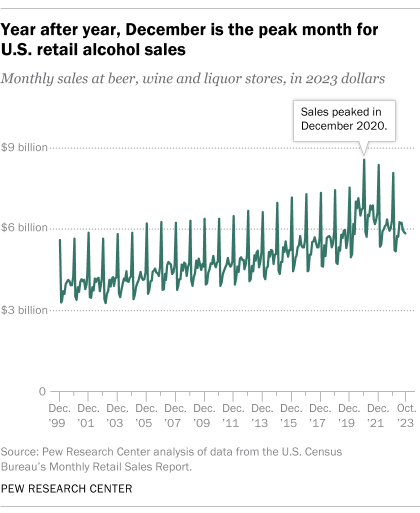
In a typical year, sales are highest in December. In 2022, according to the U.S. Census Bureau’s monthly retail sales survey, December sales at such retailers were 37% above the average for the other 11 months of the year. Conversely, January and February are typically the slowest months for those sellers.