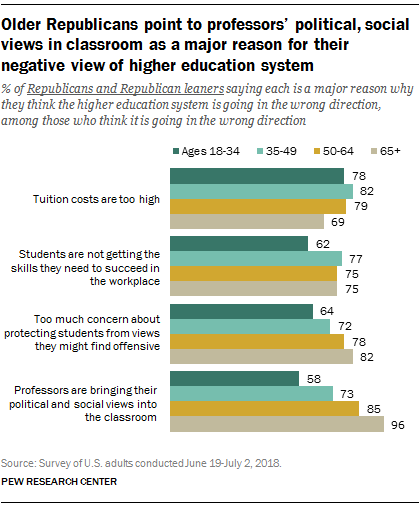
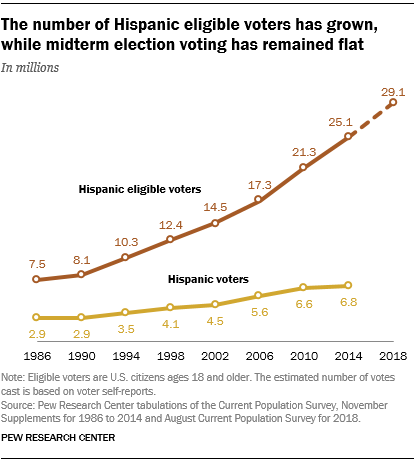
More than 29 million Latinos are eligible to vote nationwide in 2018, making up 12.8% of all eligible voters – both new highs, according to a new Pew Research Center analysis of Census Bureau data.
The pool of eligible Hispanic voters has steadily grown in recent years. Between 2014 and 2018, an additional 4 million Hispanics became eligible voters (U.S. citizens ages 18 and older). Much of this growth has been driven by young U.S.-born Hispanics coming of age. Since 2014, around 3 million have turned 18. Other sources of growth include Hispanic immigrant naturalizations – among Mexicans alone, 423,000 became U.S. citizens from 2014 to 2017 – as well as residents of Puerto Rico moving to one of the 50 states and the District of Columbia, especially Florida.
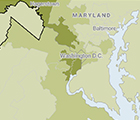
Explore the data
Explore interactive maps and tables showing key characteristics of Latino voters and overall eligible voter population in all 50 states and the District of Columbia, as well as in 414 of the nation’s 435 congressional districts.
Here are key facts about the Latino vote in 2018:
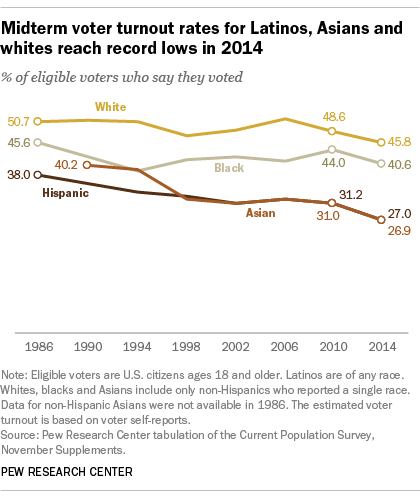
The Latino voter turnout rate in midterm elections has declined since 2006. In 2014, the turnout rate among Latino eligible voters dropped to a record low of 27.0%. (White and Asian eligible voters also had record-low turnout rates.) Despite this, a record 6.8 million Latinos voted.
Young Latinos have contributed to this low voter turnout. In 2014, just 16.0% of eligible Latinos ages 18 to 35 voted, compared with 36.2% of Latinos 36 and older. At the same time, younger Latinos make up a large share of the Hispanic electorate. About 43.5% of all Hispanic eligible voters in 2018 are 18 to 35 years old, compared with 30.6% of all U.S. eligible voters. Hispanics also account for a significant share of young eligible voters nationwide. Hispanics make up about a fifth (18.1%) of all U.S. eligible voters ages 18 to 35, but just 10.4% of eligible voters ages 36 and older.
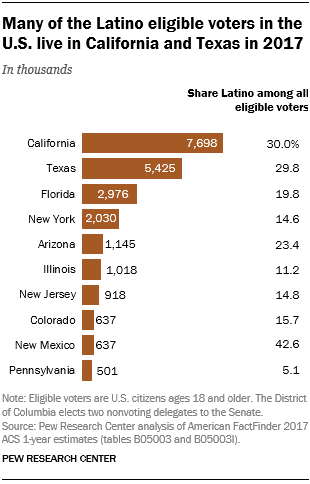
About seven-in-ten (71%) Hispanic eligible voters live in just six states in 2017 – California (7.7 million), Texas (5.4 million), Florida (3.0 million), New York (2.0 million), Arizona (1.1 million) and Illinois (1.0 million). Hispanics make up the highest share of all eligible voters in New Mexico (42.6%), followed by California (30.0%), Texas (29.8%), Arizona (23.4%) and Florida (19.8%).
Though most Hispanic eligible voters are concentrated in just a few states, their numbers have grown quickly in many states across the country. From 2014 to 2017, North Dakota saw a 32.4% increase in the number of Hispanics eligible to vote, the largest percentage increase in the nation (the state’s overall Hispanic population has also grown in recent years). South Carolina (30.1%), Oregon (28.8%) and North Carolina (28.2%) have also had large increases in Hispanic eligible voters during this time.
There are 176 congressional districts with at least 50,000 Latino eligible voters in 2017, and they contain nearly 80% of all Latino eligible voters. In one California district and three in Texas, Hispanics make up at least three-quarters of all eligible voters: California’s 40th District (81.0%) and Texas’ 34th (79.3%), 16th (76.5%) and 15th (75.1%). All four districts have Democratic incumbents. Texas’ 20th District, which covers part of San Antonio, has 357,000 Hispanic eligible voters, the most of any congressional district in the nation.
Latinos make up a small share of eligible voters in Southern states, even though these states have experienced some of the fastest Latino population growth in the country. Only about a third of Latinos living in Kentucky (36.1%), Georgia (34.8%), Arkansas (34.6%), Alabama (33.9%), North Carolina (33.2%) and Tennessee (32.0%) are eligible to vote.
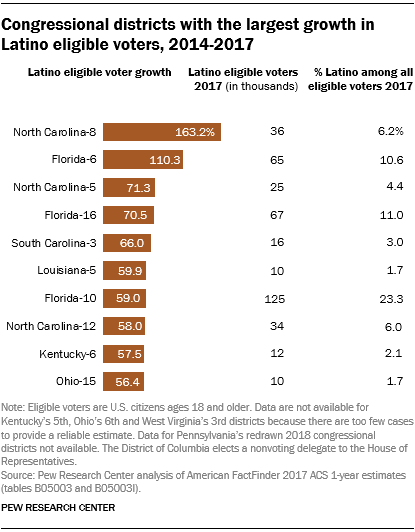
A number of congressional districts in the South saw the fastest growth of Latino eligible voters in the country. North Carolina’s 8th District saw the nation’s largest increase (163.2%) in Latino eligible voters between 2014 and 2017. The next five districts with the largest growth during this time are Florida’s 6th (up 110.3%), North Carolina’s 5th (71.3%) and Florida’s 16th (70.5%).