Many nonprobability sample vendors have the ability to provide samples of respondents that, by design, are forced to align with characteristics of the U.S. population. Often those characteristics are demographics such as gender and age, though some vendors also use nondemographic variables. When a vendor forces the sample to match the population on a particular characteristic (e.g., % female), the survey estimate of that characteristic is no longer informative about the quality of the sample because it was predetermined. This is analogous to the situation in probability-based surveys where weighting a variable to match a particular distribution through raking means that the variable could no longer be considered an informative outcome variable.
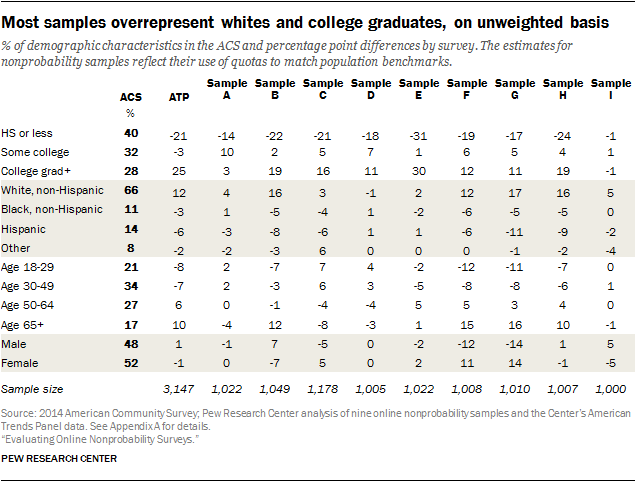
Most samples substantially underrepresent less-educated adults, on an unweighted basis
While the capacity to predetermine the demographic profile of the sample is common in nonprobability web surveys, vendors vary dramatically on what variables they use to do so. Consequently, the unweighted demographic profiles of the 10 samples show large differences.
One striking pattern is that all of the unweighted samples, with the notable exception of sample I, substantially underrepresent adults with less formal education.12 According to the Census Bureau’s American Community Survey, 40% of U.S. adults have a high school education or less. Among the 10 samples examined here, the average unweighted incidence of adults in this education group was about half that (21%). Another common, though less consistent, pattern in these samples is overrepresentation of non-Hispanic whites and adults ages 65 and older. The directions of these unweighted demographic biases are quite common in U.S. surveys across a range of designs, not just online nonprobability samples.
A good-looking sample might not translate into better survey estimates
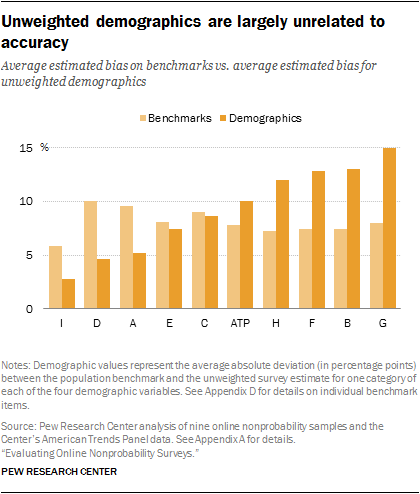
The unweighted demographic profiles reveal a curious pattern. For the most part, the demographic representativeness of a sample – on gender, age, race, ethnicity and education – is not a strong predictor of how well that sample performed in the benchmarking or in the regression analysis. Samples D and A rank worst in the benchmarking and regression analyses but rank second and third, respectively, in average deviation from population benchmarks on the five demographics.
That said, sample I ranked first in all three: benchmarking, regression and unweighted sample representativeness. The implication is that what matters is that the respondents in each demographic category are reflective of their counterparts in the target population. It does not do much good to get the marginal distribution of Hispanics correct if the surveyed Hispanics are systematically different from Hispanics in the larger population.
Measures of political attitudes and engagement

Much of Pew Research Center’s work focuses on politically relevant attitudes and behavior, including civic engagement. Several questions in the current study focused on these topics. Three items asked about political engagement: voter registration, voter turnout in local elections and contacting an elected official. Five items asked about civic engagement, including participation in community, civic or recreational groups or associations; volunteering; and working with others to solve a community problem. Measures of political attitudes included party affiliation, ideological identification and opinion about the scope of the federal government. All five civic engagement items have comparable government benchmarks, as do the two political engagement items. No benchmarks are available for the measures of political attitudes.
A well-known bias in political surveys based on probability samples is that they overrepresent the politically engaged. This bias stems from at least three sources. First, the topic of political surveys is considered more salient to politically engaged individuals, leading them to be more likely to participate in the interview.13 Social desirability bias may also introduce measurement error by leading respondents to say that they are more politically engaged than they are. And, more generally, surveys tend to underrepresent the young and the less-educated, groups that are less interested and engaged in politics than the average. Weighting may not fully correct this bias. All three of these factors may be present in nonprobability samples as well. All of the samples in this study appear to include more politically and civically engaged individuals than the benchmarks indicate should be present.
Among all benchmark items, most of the civic and political engagement measures have above-average bias, with the civic engagement items showing bigger biases than the political items.14 Participation in volunteer activity for or through a group in the past 12 months is the item with the largest bias of all 20 benchmark measures compared in this study, averaging 23.1 percentage points and ranging from 13 to 33 points. Even greater bias in relative – though not absolute – terms is seen in a question about working with others to solve a community or neighborhood problem; the mean overstatement was 20.4 points (relative to a benchmark of 7.7%) and ranged from 13 to 26 points.
Participation in each of three types of associations also reflect sizable biases in relative terms, with the share who say they have taken part in activities for a service or civic association averaging nearly double the benchmark (a mean reading of 13% vs. a benchmark of 6%). One of the nonprobability samples (sample I) actually matched the benchmark on participation in a recreational or sports organization and came within 1 point on participation in school group, neighborhood or community association.
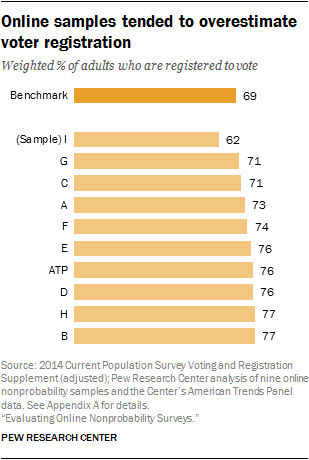
Measures of political engagement were subject to similar, though smaller, biases. Voter registration is overstated in eight of the nine nonprobability samples and the American Trends Panel, with the surveys yielding estimates higher than the benchmark of 69%; the average absolute bias is 5.7 percentage points. Sample I produced an estimate of 62%, but weighted the data to match that figure. On a measure of regularity of voting in local elections, all of the samples produced an estimate higher than the benchmark (32% say they “always” vote), with an average bias of 8.1 percentage points.
Online samples yield roughly similar results in describing the countors of U.S. political attitudes
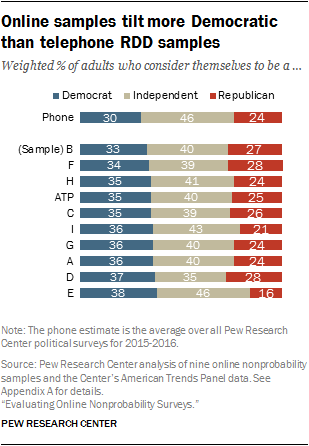
No benchmark exists for the three political attitude questions: party affiliation, self-identified ideology and opinion about the appropriate scope of government. Most of the samples produced relatively similar estimates of the Democratic and Republican shares of the public, with Democrats outnumbering Republicans in all of the samples. All of the online samples yielded higher estimated shares of adults identifying as Democrats than was found in an analysis of Pew Research Center RDD telephone surveys conducted during 2015 and 2016. Most of the online samples also yielded fewer independents (respondents who declined to affiliate with one of the two major parties) than were found in the analysis of recent telephone surveys. This could be a mode effect, though there was no statistically significant mode effect on party affiliation in the Center’s randomized mode experiment conducted in 2014 with many of these same respondents.
Estimates of the liberal-conservative divide were similar across the online samples, with conservatives outnumbering liberals in each sample. All of the nonprobability samples produced responses that were more politically liberal than conservative on a question that asked respondents about their preference regarding the scope of government.
The American Trends Panel found 48% favoring a government that does more to solve problems (rather than believing that government does too many things better left to businesses and individuals), while all of the nonprobability samples found this share to be higher than 50%, with an average of 54%.
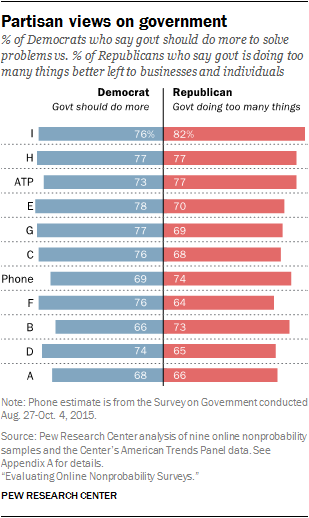
A key question in contemporary political polling concerns how polarized certain opinions are by party affiliation. Although there is no benchmark available for comparison, we can examine how Democrats and Republicans differ on attitudes measured in the survey. We expect Republicans to identify as conservative and to believe that government is doing too many things, while Democrats are more likely to self-identify as liberal and to prefer a government that does more things.
All of the samples display the expected discrimination between Democrats and Republicans on these two measures, but the extent of the division varies considerably. Sample I shows the greatest discrimination, with 82% of Republicans saying the government is doing too many things, while 76% of Democrats say the government should do more. Sample A had the smallest ideological gap on this question, with 68% of Democrats taking the liberal position and 66% of Republicans taking the conservative one. A large Pew Research Center telephone survey conducted in late 2015 found 74% of Republicans saying that government is doing too many things, while 69% of Democrats believe that government should do more. This telephone poll result falls roughly in the middle of the results for the online samples.
Interests and hobbies are generally consistent across samples
Many surveys seek to measure attitudes and lifestyle characteristics. Although no real benchmarks could be said to exist for these sorts of questions, one would expect them to be largely consistent across sample sources if the surveys are accurately representing the same population. In this study, we presented respondents with a list of 11 different activities and interests (e.g. reading the Bible, gardening, working out, celebrity news and gossip), and asked them to select each of the items of interest to them. Respondents could also select “None of the above.”
The results were broadly consistent across the different sources. Working out was the top-ranked item for all but sample F, in which it came in second. Gardening was the second-highest-ranked item for all but samples E and F, where it ranked third and first respectively. Rankings of the least popular items were also fairly stable. For all samples, the three lowest-ranked items are comprised of only four items: NBA, NASCAR, hip-hop and “none of the above.” None of the above was consistently the least frequently selected item except for samples E, G and I, for which the least commonly selected item was NASCAR. Interest in travel was the most variable category, ranging in rank from third in samples B and H to eighth in sample A. Art and theater was similarly variable, ranging from second in sample E to sixth in samples F and H.
Another way to evaluate these items is in the consistency of pairwise comparisons between individual items (e.g., which is more popular, reading the Bible or hunting and fishing?). Comparing every item to every other item yields a total of 66 comparisons. Of those 66 possible comparisons, all 10 samples agree on the more popular item for 48 of them (73%). For example, reading the Bible is more popular than hunting and fishing in all 10 of the samples, and international travel is always more popular than hip-hop. The 18 comparisons where samples do not agree perfectly are items that all tend to be within a few percentage points of each other in most samples. For instance, hip-hop is more popular than NASCAR in seven of 10 samples, and their respective levels of interest are generally within a few points of one another in each sample.
Despite general consistency, some patterns are apparent in certain samples. The American Trends Panel and sample E both show a tendency for respondents to favor choices such as art and theater and international travel. Sample E rates country music and NASCAR lower than the other samples (at 18% and 8% respectively). NASCAR and country music rate highly for sample A, while sample D stands out on interest in the NBA and hip-hop. This suggests that despite relatively good agreement overall for relative comparisons and rankings, idiosyncrasies in sample composition become apparent when the items are viewed in absolute terms.


