To better understand the current landscape of commercially available online nonprobability samples, Pew Research Center conducted a study in which an identical questionnaire was administered to nine samples supplied by eight different vendors along with the Center’s probability-based online panel. A benchmarking analysis – in which a subset of each survey’s results was compared to those from gold-standard government sources – reveals substantial variation across online sample providers in the accuracy of weighted estimates.
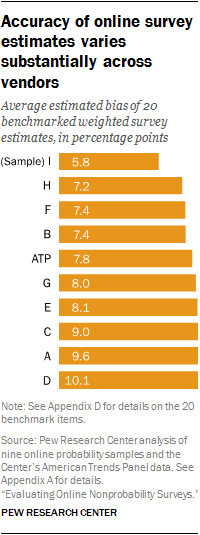
The top performing sample was nearly 1.5 percentage points more accurate on average than the second best performing sample (average estimated bias of 5.8 percentage points for sample I versus 7.2 for sample H). The most poorly performing samples yielded estimates that were about 10 percentage points off from the benchmark values on average.
In general, samples with more elaborate sampling and weighting procedures and longer field periods produced more accurate results. The less accurate samples tended to be selected (or “balanced”) only with respect to gender, age and region. The best performing samples, by contrast, were balanced not just on those characteristics but also on variables such as education and income. This latter set of samples also tended to be in the field longer, which is likely indicative of the fact that applying more rigorous selection procedures is more time consuming than using less stringent procedures. The limitations of this study’s design, however, make these conclusions preliminary at best. Our data come from just nine samples, none of which experimentally manipulated these design features. Consequently, the effects of those features are not well isolated.
In total, 20 benchmark measurements were used in this study (see Appendix D). They touch on a number of different topics including smoking, health care coverage, income, participation in civic or recreational organizations, voting, household composition, internet usage and more. The benchmarks were derived from high quality federal sources based either on national surveys or administrative data. While these are good gauges of accuracy, it is important to keep in mind that measures of political attitudes are frequent targets of surveys but only weakly related with many of these benchmark variables, and thus not necessarily subject to the same biases. For example, the fact that sample G yielded an average estimated bias of 8.0 across the 20 benchmarks does not mean that we would necessarily observe that level of bias in estimates from that sample about, for example, Americans’ views on immigration.
The sample showing the lowest average estimated bias overall (I) is also the only nonprobability sample for which the vendor-provided weights performed better than the standardized weighting protocol that we developed to align with the raking used in the Center’s probability-based online panel, the American Trends Panel (ATP). The rule employed in this study was to apply whichever weight (vendor-provided or our standardized weight) performed better in terms of minimizing the average estimated bias. This rule sacrifices a clean sample comparison in favor of a “best available package” comparison that allows for the possibility that the vendors might be able to weight their own sample more effectively than we could.
Across the nine nonprobability samples in the study, vendors provided weights for five (B, C, E, F and I). Vendors supplying the other four samples (A, D, G and H) declined to provide weights, signaling that the sample balancing (e.g., quotas) is sufficient for producing a nationally representative survey. The benchmarking results suggest that imposing a few broad quotas is not, in fact, sufficient for at least some of these samples.
While multiple vendors have the ability to sample or weight on a range of variables that go beyond standard demographics, sample I was unusual in this respect. Two of the 20 benchmarks, voter registration and internet usage, were among the variables on which sample I was adjusted. For various reasons, the weighted estimates from that sample hit neither of the benchmark values exactly. The mere fact that the sample was conditioned on these variables, however, calls into question the comparability of sample I’s performance in this benchmarking analysis relative to the other samples evaluated. Specifically, it raises the question of whether the other samples would have performed better if they too had been selected and weighted the way that sample I was. In the interest of not putting our thumb on the scale, particularly since the ATP is one of the comparison points, we allowed both of those variables to remain in the benchmarking analysis and for sample I to benefit from its better performing vendor weight.
To understand what effect those decisions have on the benchmarking results, we re-ran the analysis using just the 18 variables which, to the best of our knowledge, were not used in the sampling or weighting of any of the samples. We also re-ran the analysis imposing the standardized weight on sample I, rather than the vendor weight. In each instance, sample I still showed the smallest average estimated bias. This indicates that the superiority of sample I is not simply a function of the vendor’s weighting protocol; it stems also from recruitment and/or sample selection processes.
Tension between conditioning and measurement
While sample I performed the best on the benchmarking analysis, the manner in which that outcome was achieved highlights a critical issue for survey researchers in this era of ever-growing reliance on models to fix sample deficiencies. The design of sample I conditioned on several variables that many social scientists study as survey outcomes – political party, ideology, political interest, voter registration and internet usage. When such variables are “balanced on,” “matched on,” or otherwise “adjusted for” in the survey, they cease to be random variables estimated by the survey; instead, the survey designer has predetermined what the survey estimates (or at least the possible range of the estimates) for those variables will be. In this case, two of the variables used in the selection and weighting for sample I, voter registration and internet usage, were among the benchmarks outcomes used in the analysis.
Based on our experience commissioning these surveys, the possibility that a sample vendor would predetermine one or more variables that a researcher was intending to study is a real concern. Historically, this has been a relatively minor issue as survey vendors would typically adjust only for demographic variables (e.g., gender, age, race, region) understood by knowledgeable survey consumers to not be the key outcomes estimated in the survey. In recent years, however, there is a trend toward adjusting samples on a greater number and diversity of variables – a trend that is particularly pronounced for some online sample vendors.
Today numerous online survey vendors condition their samples on nondemographic variables in an effort to make them more representative.8 When implemented carefully and with full consideration of the survey objectives, this practice may help to improve data quality.9 If, however, the vendor adjusts the sample on attitudes or behaviors without regard for the analytic plan, there appears to be a risk of unintentional influence on study outcomes. Careful coordination between the vendor and the client researchers seems essential to avoid this problem.
Some biases are quite consistent across online samples, others are not
While the range in the average estimated biases (from a low of 5.8 percentage points to a high of 10.1) demonstrates clear differences across the online nonprobability samples, the direction of the biases reveal some commonalities.
All of the samples include more politically and civically engaged individuals than the benchmark sources indicate should be present. The biases on measures of volunteering and community problem-solving were very large, while those on political engagement were more modest. For example, the nine online nonprobabilty samples overestimated the share of adults who worked with neighborhoods to fix a problem or improve a condition in their community or elsewhere during the past year by an average of 20 percentage points. These same samples overestimated the share of adults who always vote in local elections by an average of 9 points. Despite concerns about measurement error on these items, it is accepted that these errors are real because several studies have documented a link between cooperation with surveys and willingness to engage in volunteer activities.
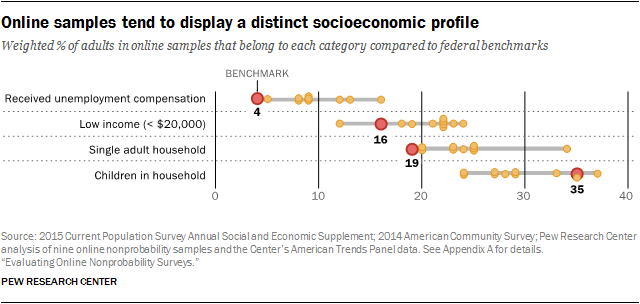
There is also evidence, though less consistent, that online nonprobability samples tend to tilt more toward certain lifestyles. In particular, most of the samples have disproportionately high shares of adults who live alone, collect unemployment benfits, do not have children and are low-income. For example, according to the Department of Labor’s Current Population Survey (CPS), 4% of U.S. adults live in a household in which someone received state or federal unemployment compensation during the past year. The average of the weighted estimates from the nine nonprobability samples, by contrast, was 10% and ranged from a low of 8% (samples H and I) to a high of 16% (sample D). On other topics, however, the online nonprobabilty estimates are either quite accurate or the biases are not in a consistent direction. For example, all of the samples yielded weighted estimates that were reasonably close (within 4 percentage points) to the benchmark incidence of having a driver’s license (86%).
Performance of the American Trends Panel
The American Trends Panel, Pew Research Center’s national panel of adults recruited at the end of a large, dual frame RDD survey, is the only probability-based sample in the study. Like the other samples evaluated, the majority of respondents participated online, but the ATP differs in that it also features mail response for adults who do not have internet access. All members of the ATP are asked to complete each of the surveys, which are administered roughly monthly. All of the nonprobability samples, by comparison, select potential respondents for a given survey by subsampling from their panel and, for some, from river sources.10
In this study the ATP is not intended to represent all probability samples in any meaningful way, but rather provides one point of comparison. The cumulative response rate for a typical survey on the ATP is 3.5%, reflecting the fact that substantial attrition has taken place even after the recruitment telephone surveys with response rates around 9% are completed. How a one-off dual frame RDD sample or some other probability-based approach would stack up in this analysis is an open question. Future Pew Research Center work will bring data to bear on this issue.
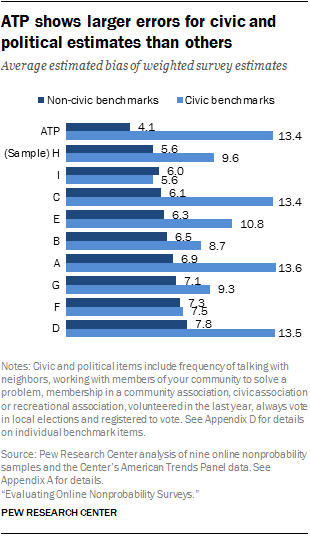
In this analysis, the lone probability-based panel – the ATP – does not stand out as consistently more accurate than the nonprobability samples, as its overall strong showing across most of the benchmark items is undermined by shortcomings on civic-related topics. Overall, the ATP ranked fifth in average estimated bias among the 10 samples evaluated. It had the lowest average bias on measures unrelated to political and civic engagement (4.1 percentage points), but was essentially tied with three other samples as having the largest bias on those types of questions (13.4 points).
A likely explanation for this pattern is that the ATP is biased toward more civically engaged adults as a consequence of being recruited from a 20-minute telephone survey about politics. As Pew Research Center has previously reported, people who engage in volunteer activity are more likely to agree to take part in surveys than those who do not. It is logical that cooperation with a lengthy telephone survey on politics narrowed the potential pool of ATP members to those more inclined toward civic and political engagement. The panel recruitment, in turn, may have been further narrowed to those who viewed their telephone survey experience favorably.
There is some evidence in this study for these compounding factors. Based on our estimate from the CPS, about 69% of all U.S. adults are registered to vote. The registration estimate from the telephone survey used to recruit the ATP was 73%, and the ATP estimate used in this study (from Wave 10) was 76%. Registered voters were more likely than the unregistered to join the panel, and over time the unregistered adults in the panel have been slightly more likely to drop out.11
Estimates for Hispanics, blacks, young adults tend to be especially biased
Topline estimates are important, but surveys also try to characterize opinions and behaviors of key population subgroups. This raises the question of whether the average bias levels observed for full sample estimates vary across key subgroups. To gauge this, we computed the benchmarks for major subgroups defined by gender, age, education, race and ethnicity and repeated the analysis for each subgroup. This analysis uses all of the benchmarks except for having a driver’s license (no microdataset was available to compute subgroup benchmark values for that characteristic).
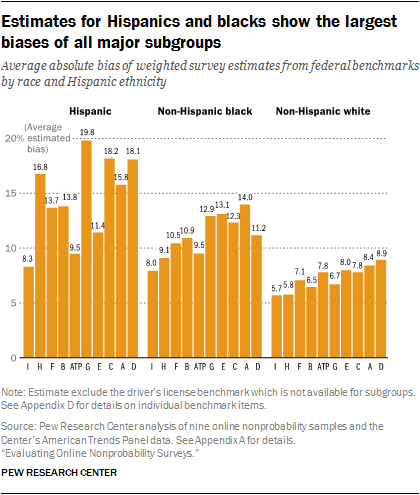
Online nonprobability sample estimates based on Hispanics and blacks show particularly large biases. Across the nine nonprobability samples, the average deviation from the benchmarks was 15.1 percentage points for Hispanic estimates and 11.3 percentage points for estimates for blacks. Sample I and the ATP are the only samples examined that have average benchmark deviations in the single digits for both of these subgroups.
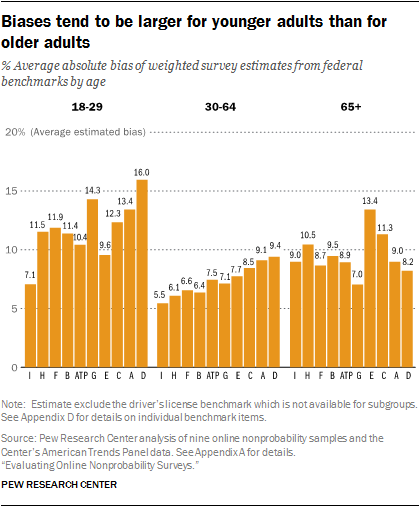
Estimated biases were also particularly large for young adults. The pattern of larger average biases for younger adult estimates than older adult estimates (11.8 points for ages 18-29 versus 9.6 points for ages 65 and older) is somewhat surprising given that young adults have much higher levels of internet usage, suggesting that they might be better represented in online panels.
Estimated bias also varied by gender. All of the samples in this study had larger biases when making inferences about men than about women. Across the nine nonprobability samples, the average deviation was 9.9 percentage points for men versus 7.6 points for women.
Differences across education categories were not too dramatic, though the average estimated biases tend to be somewhat larger for estimates based on adults with a high school education or less than for estimates based on adults with more formal education.
Caveats about benchmarks
Assessing bias in surveys requires an objective standard to which survey findings can be compared. Election polling has such a standard, at least for measures of voting intention: the outcome of the election. Administrative records, such as the number of licensed drivers as used in this report, can provide others. But most such benchmarks are taken from other surveys. Aside from the number of licensed drivers, the benchmarks used here are drawn from large government surveys that are conducted at considerable expense and with great attention to survey quality. But they are nevertheless surveys and are subject to some of the same problems that face surveys like the American Trends Panel and the nonprobability surveys being examined here.
Government surveys tend to have very high response rates compared with probability samples conducted by commercial vendors or nonprofit organizations like Pew Research Center. Accordingly, the risk of nonresponse bias is generally thought to be lower for these government surveys, though it still exists. More relevant is the fact that all surveys, no matter the response rate, are subject to measurement error. Questions asked on government surveys are carefully developed and tested, but they are not immune to some of the factors that create problems of reliability and validity in all surveys. The context in which a question is asked – the questions that come before it – often affects responses to it. Given that our study selects benchmarks from more than a dozen different government surveys, it is impossible to re-create the exact context in which each of the questions was asked. Similarly, all survey items may be subject to some degree of response bias, most notably “social desirability bias.” Especially when an interviewer is present, respondents may sometimes modify their responses to present themselves in a more favorable light (e.g., by overstating their frequency of voting). All of these factors can affect the comparability of seemingly identical measures asked on different surveys.
One other issue: Benchmarks are generally unavailable for questions about attitudes and behaviors that the government does not study. As a result, this analysis uses benchmarks for only a subset of the questions asked on the survey. Moreover, Pew Research Center’s work – and the work of other polling organizations conducting political and social research – tends to focus on subjects and questions other than the ones for which benchmarks are available. The generally good record of public polling in presidential elections, including Pew Research Center’s surveys, suggests that well-designed surveys using either probability or nonprobability samples can provide accurate measures of political preferences. But election polling’s record is hardly unblemished, and candidate choice is but one phenomenon among many we study. Assessing the quality of data is an inexact process at best. It is therefore important to bear in mind that benchmarking provides measures of estimated bias and is highly dependent on the particular set of measures included.


