An additional analysis stemming from the Kuriakose & Robbins piece is a scatter plot showing the number of questions (x-axis) against percentage of near duplicates (y-axis). This raised the question — if more questions in a survey cause a lower near duplicate rate, shouldn’t that be apparent in the scatter plot? One of the problems with the graph is that several important survey characteristics are confounded when run that way in a simple bivariate analysis.
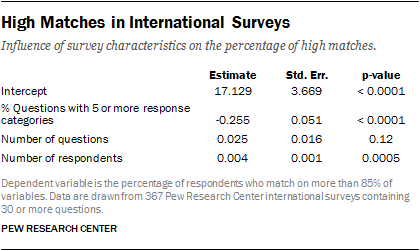
To demonstrate this point, we conducted an additional empirical analysis. Using 367 Pew Research Center international surveys, we ran a regression predicting the percentage of near duplicates using the following covariates: the number of questions, the sample size, and the percentage of questions with five or more response options.
As the results show, two survey characteristics are significant predictors of the percentage of near duplicates. The number of questions turned out to be not significantly predictive, however, the sample size and the proportion of questions with five or more response categories both have a strong association with the percentage of near duplicates. The larger the sample size, the higher the percentage of near duplicates. The greater the proportion of questions with 5+ response options, the lower the percentage of near duplicates. This adds to the evidence in our paper that a uniform threshold of 85% is wrong-headed because survey characteristics affect the likelihood of there being a high match rate. All of the 367 datasets in this analysis are publically available on our website and the R code for this regression is available upon request.


