by Paul Taylor
On a day when not much else went right for them, Republican congressional candidates on Nov. 7 rolled up a record margin of victory among one quintessentially American voting bloc: the nation’s optimists.
 But even that triumph may have tasted a bit bitter, for the GOP candidates wound up capturing a much bigger slice of a much smaller pie.
Indeed, in the six years since President Bush was first elected, two unprecedented things have happened to America’s optimists. They’ve become much more Republican. And there are many fewer of them.
These trends are brought into sharp relief by Election Day exit polls taken in 2000 and 2006 and re-enforced by longer-term patterns from a “ladder of life” battery of questions administered by the Pew Research Center and the Gallup Poll every few years since 1964.
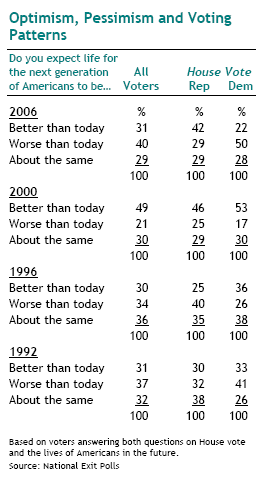
The nationwide Election Day exit poll question asks voters: “Do you expect life for the next generation of Americans to be better than life today, worse than life today, or about the same?”
A plurality (40%) of voters on Nov. 7 said “worse,” while 31% said “better” and 29% said the “same.” Six years earlier — in an election that took place before September 11 and after a sustained period of economic prosperity — voters had been much more optimistic. In the 2000 exit poll, nearly half (49%) of respondents said the next generation would do better, while just 21% said it would do worse and the remainder (30%) said it would do the same.
Sharp as this downturn in optimism has been, the swing in the partisan voting patterns of the optimists has been even sharper.
In 2006, Republican House candidates carried the optimists’ vote by a margin of roughly two-to-one. But back in 2000, Democratic House candidates carried a majority of the optimists — just as they had in 1996 and 1992.
This migration of optimists into Republican terrain tracks with two other big shifts in public attitudes. Since 2000, opinions about the economy and the overall direction of the country have become much more polarized along partisan lines than they were during the 1990s. And on both fronts, Republicans now register much higher levels of satisfaction than do Democrats.
On top of this, there’s another factor that may have contributed to the dramatic swing in the exit polls. This was an election that many voters treated as a referendum on the Bush era, and the inherently partisan setting of the poll (taken among voters as they are leaving the polling place) may have primed Democratic respondents to see a dark future and Republican respondents to see a bright one.
Ladder of Life
For a more stable barometer of trends in national optimism, it’s worth examining the “ladder of life” series of questions that have been asked by Pew and Gallup since 1964. These questions are not posed on Election Day, nor are they asked of respondents who have been cued to think about politics or partisanship. As a result, the historic trend lines from this question are less volatile than those drawn from the exit polls. But the basic story they tell is the same — since the turn of the century, America’s optimists have grown fewer in number and more Republican in makeup. In scale and scope, both changes are unprecedented in the four-decade history of this question.
Unlike the exit poll question, the ladder of life questions probe for attitudes about one’s own prospects in life, not about the prospects of the next generation of Americans. It asks about personal optimism, not national optimism.
 But part of the methodological elegance of this famous battery, developed about a half-century ago by Princeton University psychologist Hadley Cantril, is that respondents aren’t asked, directly, to evaluate their own progress in life. Rather, they are asked to imagine a ladder with ten steps, with 10 representing the highest possible quality of life for them and zero the lowest. Then they’re asked which step of the ladder they feel they’re on at the present time; which step they were on five years ago; and finally, which step they expect to be on five years from now. People aren’t asked to make “better” or “worse” judgments. They’re simply asked to assign numerical ratings to their life at three different points in time.
The results are striking — for their long-term stability; for their recent downturn; for their growing partisan coloration; and, finally, for their enduring paradox.
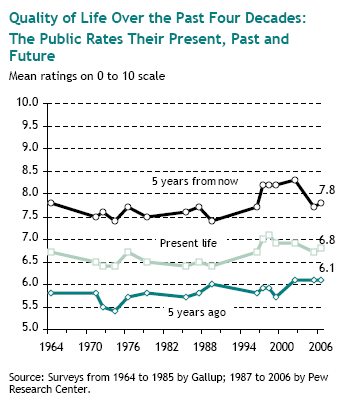
On the stability front, consider this: In the 16 times that Gallup and Pew have asked this question since 1964 — through good times and bad times, through war and peace, through recessions and booms, through Republican eras and Democratic eras — the present always gets a higher mean rating than the past, and the future always gets a higher mean rating than the present.
For example, in the 2006 Pew survey (taken this summer), Americans on average gave a 6.1 score to their lives five years ago; a 6.8 score to their present quality of life; and a 7.8 score to the lives they expect to be leading five years from now. That adds up an aggregate average of 1.7 rating points worth of forward progress between five years ago and five years hence.
Pretty good, no?
Actually, it’s a bit below the historic average of 2.0 rating-points-worth of forward progress, and it’s fully one-third below the 1999 high water mark of 2.5 points-worth of forward progress.
In the four decades that Pew and Gallup have asked the ladder of life battery, that’s the steepest and most sustained decline in this measure of personal progress. Americans are still upbeat about the trajectory of their own lives, but they’re about a third less optimistic now than they were in the late 1990s.
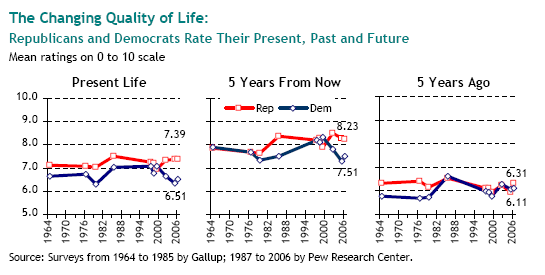
Moreover, the surveys show a sharp divergence since the turn of the century in the way Democrats and Republicans evaluate their lives. Among Republicans, mean ratings for both the present and future have risen; among Democrats, both sets of ratings have fallen. (There is virtually no partisan gap and there has been very little change in ratings that people give to the past).
An Enduring Paradox
All of these trend lines are food for endless layers of analyses — be they about changing patterns in life satisfaction and economic mobility, or about the shifting political fortunes of the two major parties.
But before making too much of any of them, one should perhaps pause a moment to contemplate a paradox that has dogged the “ladder of life” question throughout its long and distinguished career.
Looking at the trend lines in the responses over the past 40 years, you cannot help but be struck by an unyielding, even poignant pattern: the future, once it finally arrives, never lives up to today’s expectations of it. It’s as if Americans are dogs at a race track, forever chasing the mechanical rabbit that forever scampers beyond reach.
To cite just one example: in 1997 the public, on average, expected to enjoy an 8.2 quality of life in 2002. But by the time 2002 rolled around, the public, on average, rated the present as a 6.9. This same anomaly shows up every time this survey has been taken over the past four decades, and it also applies, in reverse, to perceptions of the past (the public always rates the past worse in retrospect than they rated it at the time).
So the paradox boils down to this: if the public’s ratings at any given point in time are to be taken at face value, the typical American’s quality of life is constantly improving over time. The present always surpasses the past, and the future always surpasses the present. But the very same rating system that builds this blissful portrait of perpetual human progress also eviscerates it. For when you look at the public’s ratings of the present from one year to the next, you see that it almost never changes.
What gives?
Some psychologists theorize that human beings can’t help themselves; they’re hard-wired to imagine brighter tomorrows because the act of doing so is pleasurable in and of itself.
Economist Richard Easterlin of the University of Southern California adds an economic dimension to this psychological trap. Over the course off their adult lives, he notes, most people acquire more money and material goods. That’s a big part of the reason they expect tomorrow to be better than today (and rate today better than yesterday). However, once people get more, they also want more — and so they never achieve the higher levels of satisfaction that they’d previously assumed would come from having more.
This is a neither a new insight nor a new dilemma. Back in 1776, long before survey researchers started asking their questions, writer Samuel Johnson observed: “Life is a progress from want to want, not from enjoyment to enjoyment.” More recently, Oscar Wilde quipped: “In the world there are only two tragedies. One is not getting what one wants. The other is getting it.”
If any political party can figure out a way to take the edge off those tragedies, it probably has a bright future.
For a detailed look at how different demographic groups in the United States, as well as different national publics around the globe, assess their progress in life, go to “Americans See Less Progress on Their Ladder of Life.”
